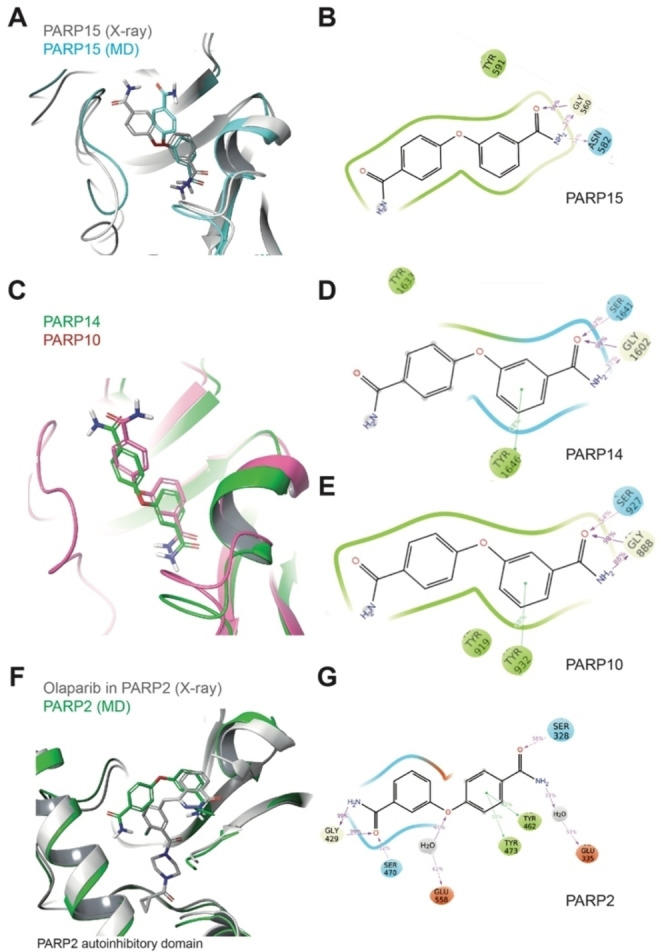
Figure 7.

Comparative structural analysis of compound 20 in different ARTDs using MD simulations. A) Structural comparison of the modeled 20‐PARP15 (representative structure from MD simulation) with the 20‐PARP15 crystal structure. B) 2D interaction schemes of the modeled 20‐PARP15 complex (from panel A). C) Structural comparison of the modeled 20‐PARP10 and 14 complexes (representative structures from MD simulation). D) 2D interaction scheme of the modeled 20‐PARP14 complex (from panel C). E) 2D interaction scheme of the modeled 20‐PARP10 complex (from panel C). F) Structural comparison of the modeled 20‐PARP2 (representative structure from MD simulation) and the Olaparib‐PARP2 crystal complexes. G) 2D interaction schemes of the modeled 20‐PARP2 complex (from panel E). For panels B, D and F: The percentage of occurrence of the main interactions during the overall MD trajectories is indicated. Green, red and cyan spheres indicate hydrophobic, negatively charged and polar residues, respectively. While grey and white spheres are for Gly and water, respectively. Green lines indicate pi‐stacking interactions, while pink arrows indicate the presence of hydrogen bonds.
