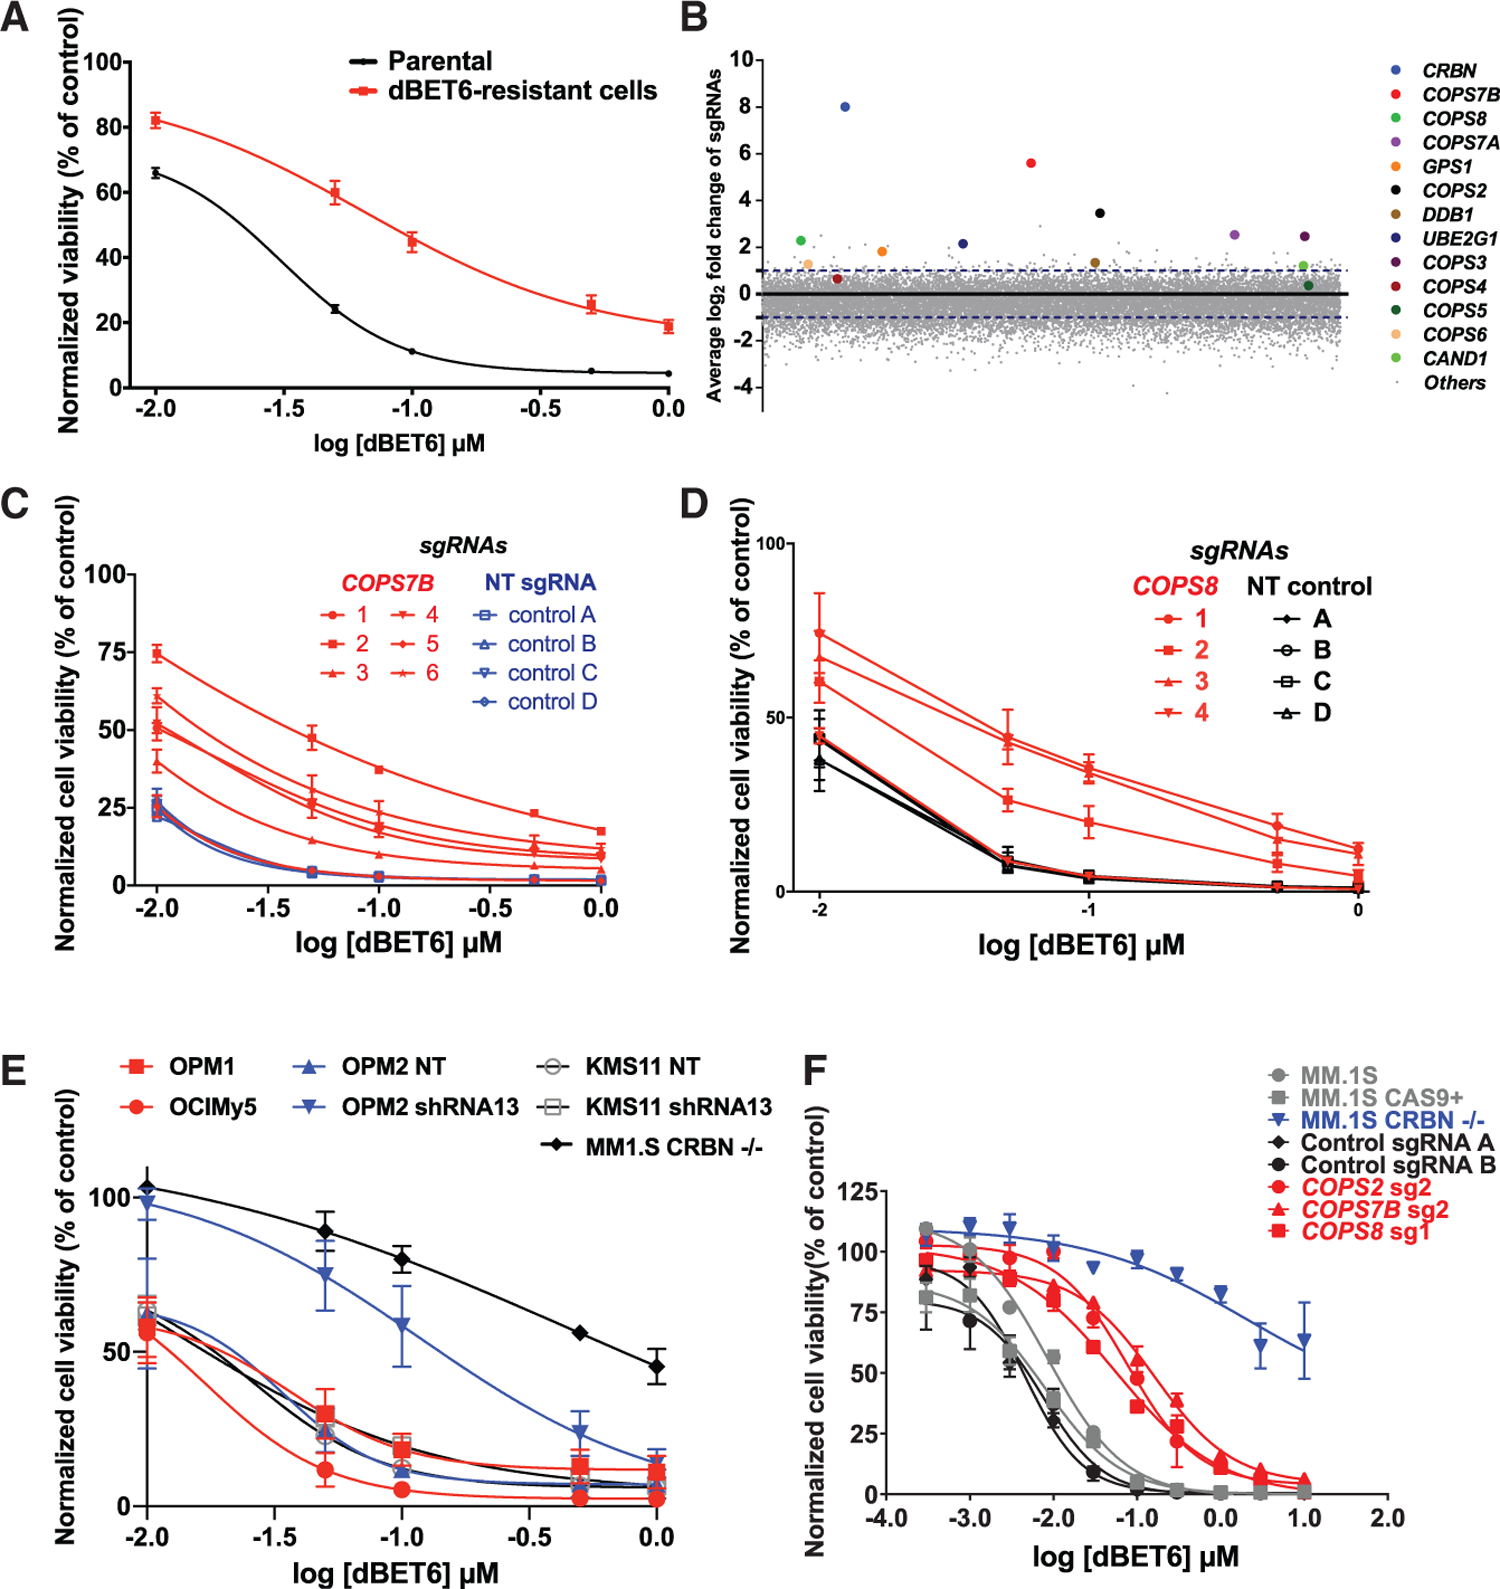
Figure 1. Resistance to dBET6 by Dysregulation of CRBN and Its Interactors/Regulators.

(A) dBET6 dose-response curves (CellTiter-Glo [CTG] assays, 48 h) for pools of MM.1S cells that survived repeated dBET6 treatments during the long-term genome-scale CRISPR gene editing screen versus dBET6-naive cells (2-way ANOVA; p < 0.05 in terms of drug dose and p < 0.05 in terms of status of prior treatment with dBET6 or no treatment).
(B) Average log2 fold change (log2FC) of normalized read counts for sgRNAs against CRBN and several of its interactors after repeated dBET6 treatments during the long-term genome-scale CRISPR gene editing screen.
(C and D) MM.1S-Cas9+ cells transduced with individual sgRNAs for COPS7B and COPS8 (versus control sgRNAs) were tested for in vitro response to dBET6 (48 h; 2-way ANOVA; p < 0.05 in terms of drug dose and p < 0.05 in terms of status of transduction with five of the sgRNAs for COPS7B or three sgRNAs for COPS8 versus non-targeting (NT) control sgRNAs).
(E) MM cell lines known to express low but detectable CRBN levels constitutively (OPM1 and OCI-My5) or after transduction with shRNAs against CRBN (KMS11, OPM2) were tested for their in vitro response to dBET6 (48 h).
(F) dBET6 dose-response curves (72 h) for MM.1S-Cas9+ cells transduced with sgRNAs against CRBN (MM.1S CRBN−/−), COPS7B, COPS2, COPS8, or non-targeting control sgRNAs.
(A) and (C)–(E) depict averages ± SE of 3 independent experiments (CTG) for each panel, with triplicates per condition. (F) depicts averages ± SE from a single experiment with triplicates per condition.
