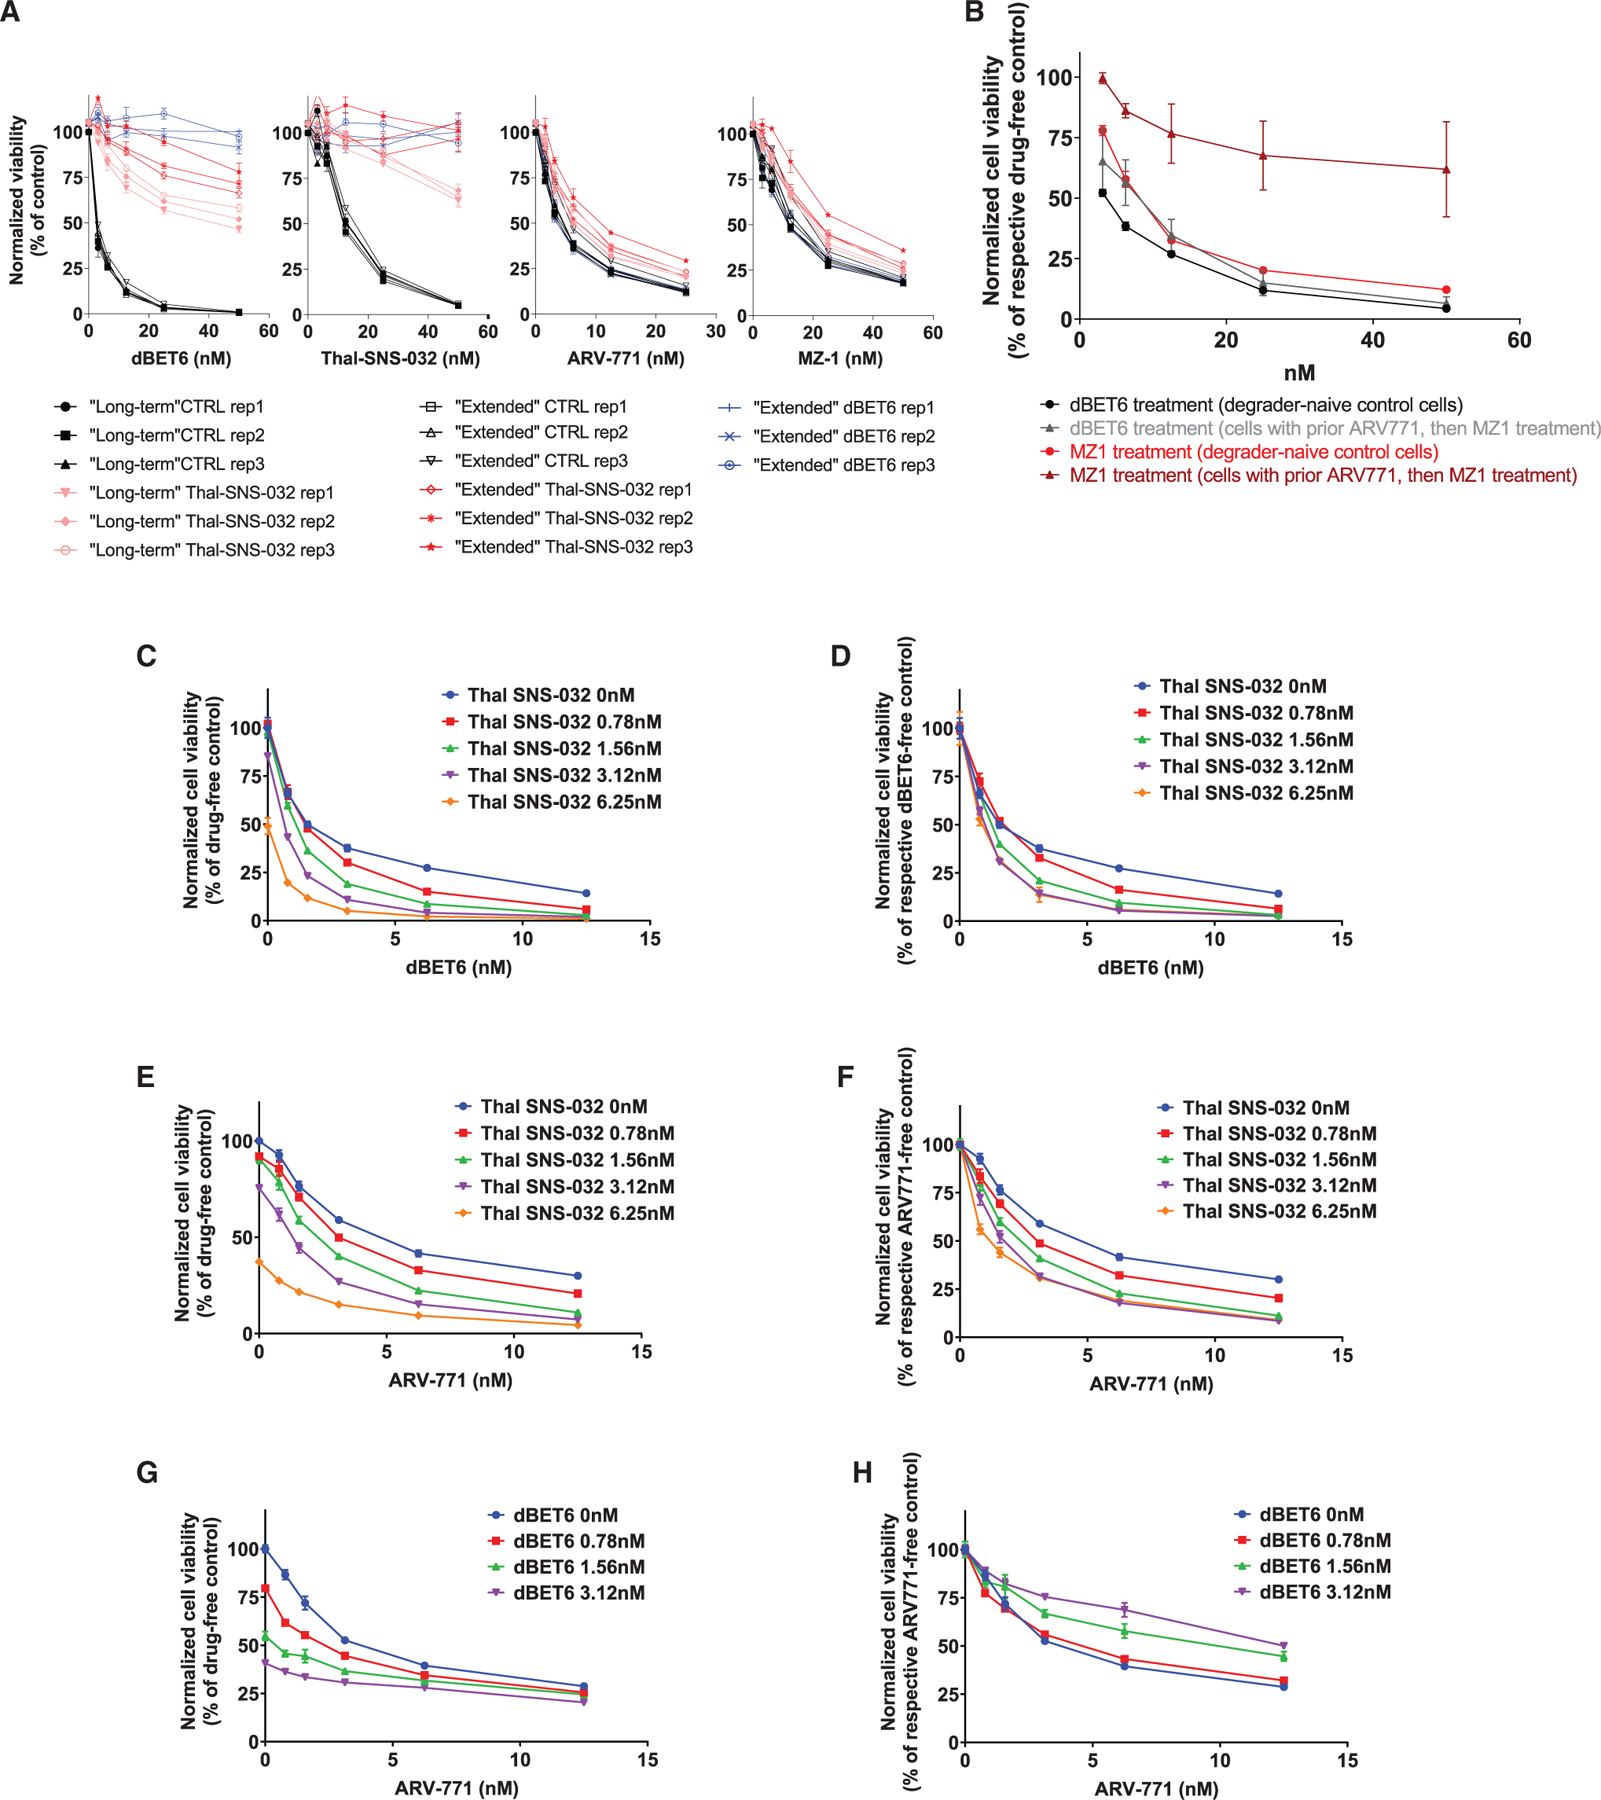
Figure 4. Sequential versus Concomitant Administration of CRBN- and VHL-Based PROTACs.

(A) Dose-response curves (CTG assays, 72 h) for dBET6, Thal-SNS-032, ARV-771, or MZ-1 treatment of pools (3 Rep pools for each population) of MM.1S-Cas9+ cells that survived in CRISPR-based studies after (1) long-term treatment with Thal-SNS-032 or long-term treatment with Thal-SNS-032 followed by extended treatment with (2) Thal-SNS-032 or (3) dBET6 versus (4) populations of drug-naive control (CTRL) cells that remained in culture during long-term or extended treatments and were collected at the end of the respective studies.
(B) Pools of MM.1S-Cas9+ cells that survived, in genome-scale CRISPR-based studies, long-term treatment with ARV-771 and then extended MZ-1 treatment were tested for their response to MZ-1 or dBET6 (CTG assay, 72 h. All experimental conditions received non-cytotoxic concentration of MDR1 inhibitor [see Methods] to prevent potential confounding by nonspecific MDR1 effects on response to all degraders).
(C–H) Combined administration of CRBN- or VHL-based PROTACs. MM.1S-Cas9+ cells were exposed simultaneously to the indicated concentrations of (C and D) Thal-SNS-032 plus dBET6, (E and F) Thal-SNS-032 plus ARV-771, and (G and H) dBET6 plus ARV-771. Cell viability (CTG assays, 72 h) results are depicted, for each combination, as percent viable cells compared with drug-free controls (C, E, and G) or the respective dBET6- or ARV-771-free cultures for each Thal-SNS-032 or dBET6 dose level (D, F, and H).
Shown are averages ± SE of triplicates per condition in each experiment.
