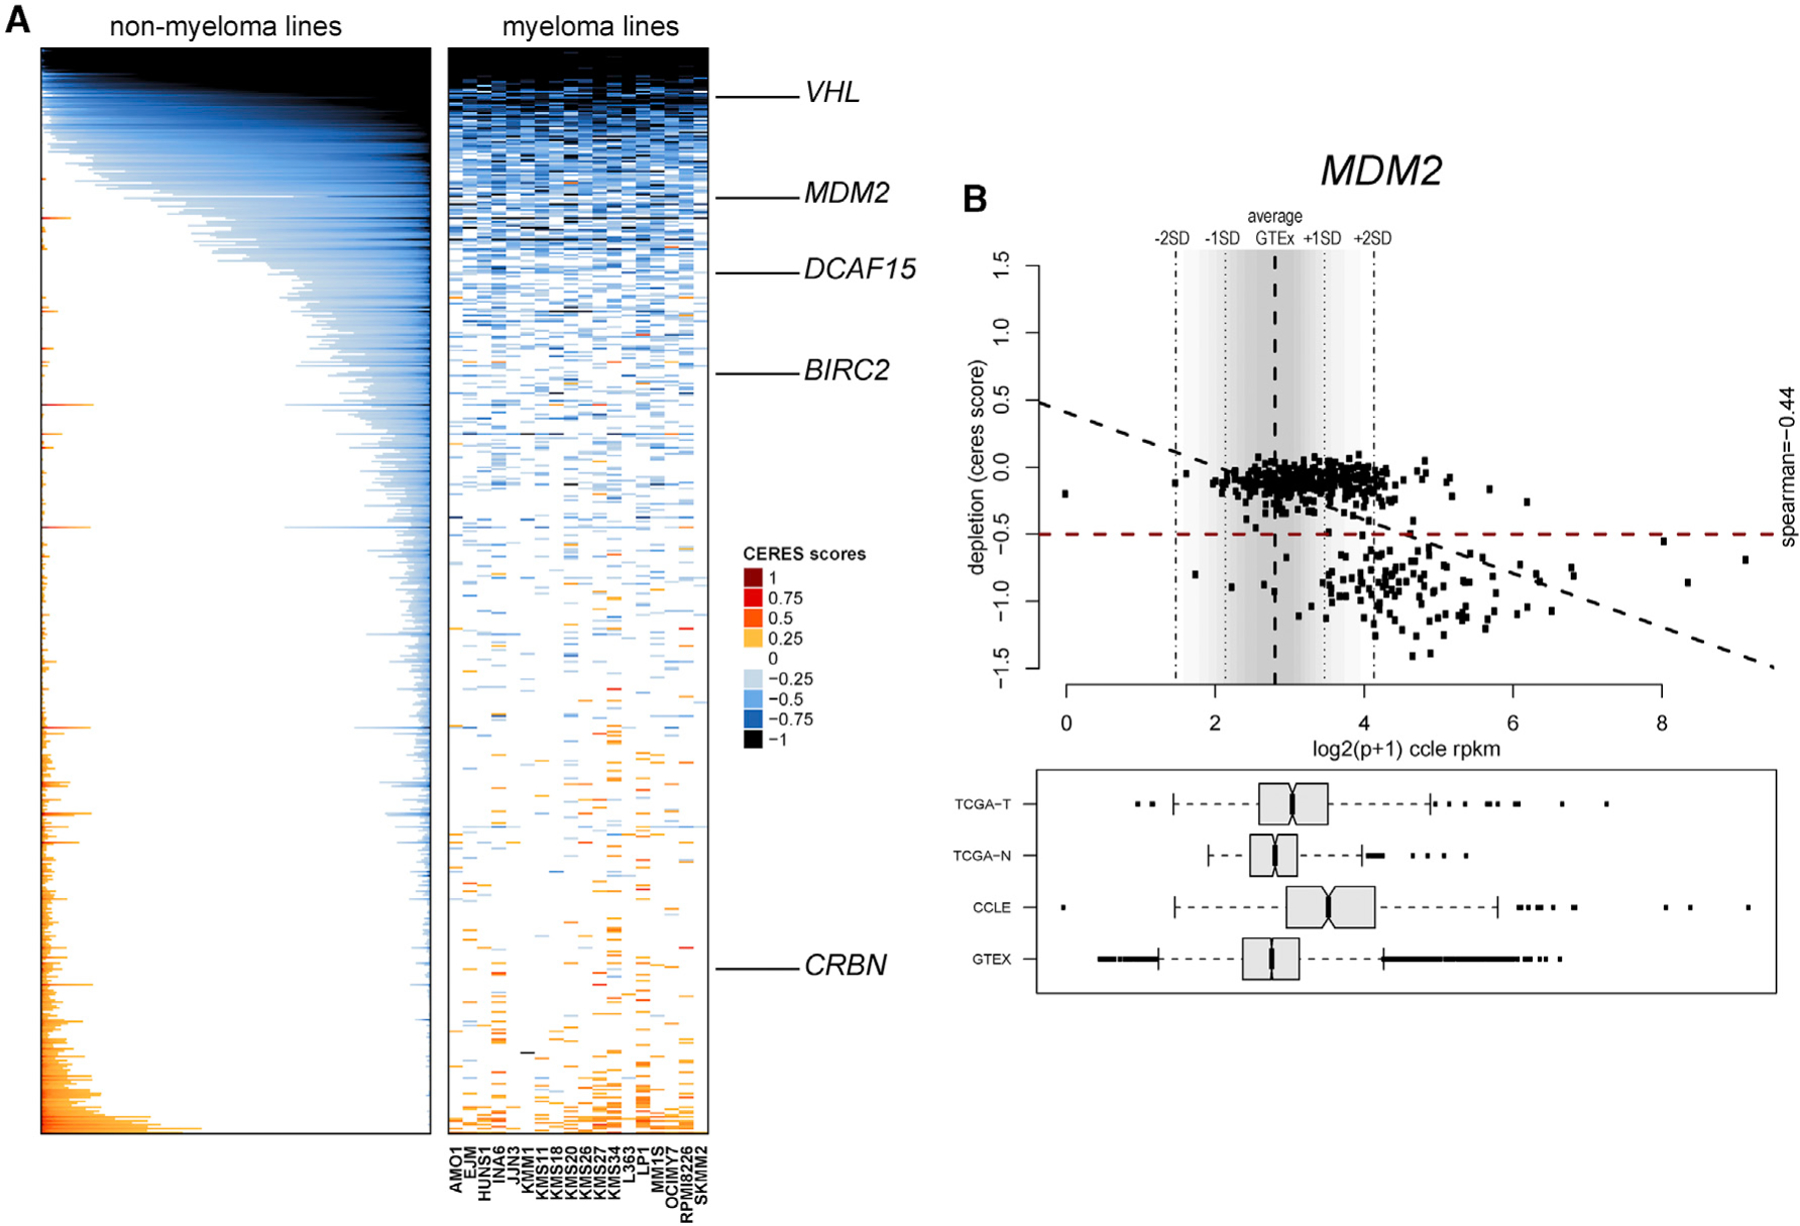
Figure 5. Functional Genomic Landscape of E3 Ligases as Dependencies in Human Tumor Cells.

(A) Color-coded heatmaps depict CERES scores as quantitative metric of essentiality for E3 ligase genes in human tumor cell lines based on CRISPR gene editing screens (AVANA sgRNA library) in vitro in the absence of drug treatment. CERES scores for MM cell lines are depicted as a matrix (right side of graph) of cell lines (in columns) and genes (in rows), whereas data for non-MM lines are depicted for each gene (row) in stacked bars to visualize CERES scores in descending order (from left to right) for each gene. Black or dark blue indicates negative CERES scores compatible with pronounced sgRNA depletion in a given cell line. Genes are ranked from top to bottom in descending order of the average CERES scores in all tumor cell lines. Examples of key E3 ligases leveraged for development of PROTACs are highlighted.
(B) Example of evaluation of an E3 ligase (in this case MDM2) for the relationship between transcript levels in tumor versus normal cells and the gene’s status as a dependency. Data from the GTEx database were used to define the distribution (average ± 2 SD) of MDM2 transcript levels across a broad range of normal tissues. In the bottom panel, transcript levels from The Cancer Genome Atlas (TCGA; normal tissues [TCGA-N] and tumors [TCGA-T]) study and cell lines from the Cancer Cell Line Encyclopedia (CCLE) panel and GTEx are included for comparative purposes, and data are presented in boxplots (representing the average and interquartile range in each group; error bars represent the upper and lower limits of the 95% confidence interval, whereas individual dots represent samples with outlier expression). The upper part of (B) highlights the relationship between transcript levels (based on RNA-seq data from the CCLE) and CERES scores for MDM2 in tumor cell lines. The bottom right quadrant of the top panel highlights tumor cell lines with MDM2 transcript levels above the average + 2 SD of transcript levels in normal tissues of GTEx (high expressors) and CERES scores of less than ‒0.5. Linear correlation analysis examines the inverse association of high MDM2 transcript levels and low CERES scores (Spearman correlation coefficient = ‒0.44, p < 0.05).
