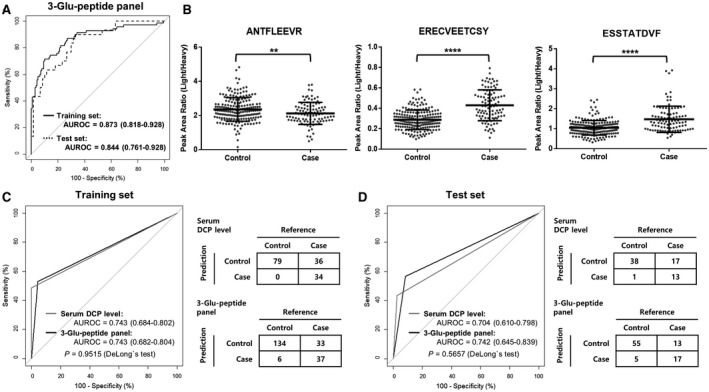
FIG. 2.

Assessment of the diagnostic performance of the DCP three‐Glu‐peptide panel in the training and test sets and comparison with the immunoassay at the optimal cut‐off point. (A) ROC curves for the DCP three‐Glu‐peptide panel in the training (solid black line) and test sets (dotted black line). The AUROC of the DCP three‐Glu‐peptide panel was 0.873 in the training set, which was consistent with the test set, which had an AUROC of 0.844 (DeLong`s test, P = 0.5722). (B) The relative concentrations of three Glu‐peptides in the training and test sets. The relative concentrations of ANTFLEEVR peptide were significantly lower in cases than in controls, whereas those for ERECVEETCSY and ESSTATDVF were significantly higher in cases than in controls. The comparisons of relative concentrations separately plotted for the training and test sets are shown in Supporting Fig. S5. (C,D) Comparison of the ROC curve and the corresponding confusion matrix at the optimal cutoff for the DCP three‐Glu‐peptide panel and the serum DCP level from the immunoassay, respectively, in the (C) training set and (D) test set. The optimal cut‐off value for the serum DCP level (gray lines) was 40 mAU/mL and that of the three‐Glu‐peptide panel (black lines) was 0.432, presented by the Youden Index for the training set (shown in Supporting Fig. S4). The AUROC of the DCP three‐Glu‐peptide panel was statistically equivalent to that of the immunoassay at the optimal cut‐off value in the training and test sets (DeLong`s test, P > 0.05). All AUROC values are summarized with 95% CI for ROC curves. Relative concentrations of three Glu‐peptides were plotted as PARs of light peptides to heavy SIS peptides for individual patients. Middle horizon lines and error bars indicate the mean and SD, respectively. P values were calculated with the Mann‐Whitney U test to compare the relative concentrations of each peptide. **P < 0.01, ****P < 0.0001.
