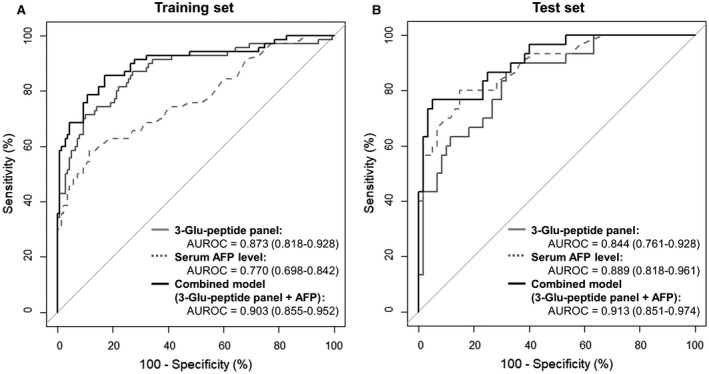
FIG. 3.

Comparison of the diagnostic performances of the DCP three‐Glu‐peptide panel, serum AFP levels, and a combined model (DCP three‐Glu‐peptide panel and serum AFP level) in the training and test sets. AUROC values are presented with 95% CI for ROC curves. The combined model (black lines) had a higher AUROC value than the DCP three‐Glu‐peptide panel (solid gray lines) or serum AFP levels (dotted gray lines) alone, for all data sets. (A) In the training set, the combined model had a higher AUROC value (0.903) than either AFP levels (0.770) or DCP three‐Glu‐peptide panel (0.873) alone. The AUROC value for the combined model was statistically different from that for AFP levels (DeLong`s test, P < 0.05) but not for the DCP three‐Glu‐peptide panel (DeLong`s test, P = 0.079). (B) In the test set, the combined model also had a higher AUROC value (0.913) than both the AFP levels (0.889) and the DCP three‐Glu‐peptide panel (0.844). The AUROC value for the combined model was statistically different from that for the DCP three‐Glu‐peptide panel (DeLong`s test, P < 0.05) but not from AFP levels (DeLong`s test, P = 0.484).
