FIG. 6.

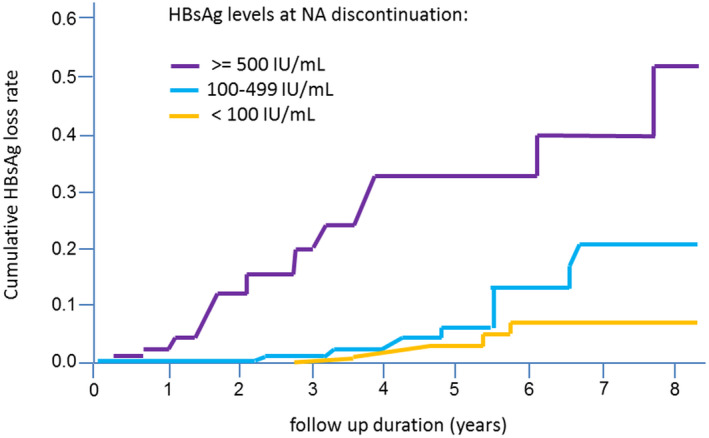
Cumulative HBsAg loss rates according to different HBsAg levels at the time point of NA treatment discontinuation (log‐rank test, P < 0.0001). (Adapted from Fig. 4 of Ref. 65).

Cumulative HBsAg loss rates according to different HBsAg levels at the time point of NA treatment discontinuation (log‐rank test, P < 0.0001). (Adapted from Fig. 4 of Ref. 65).