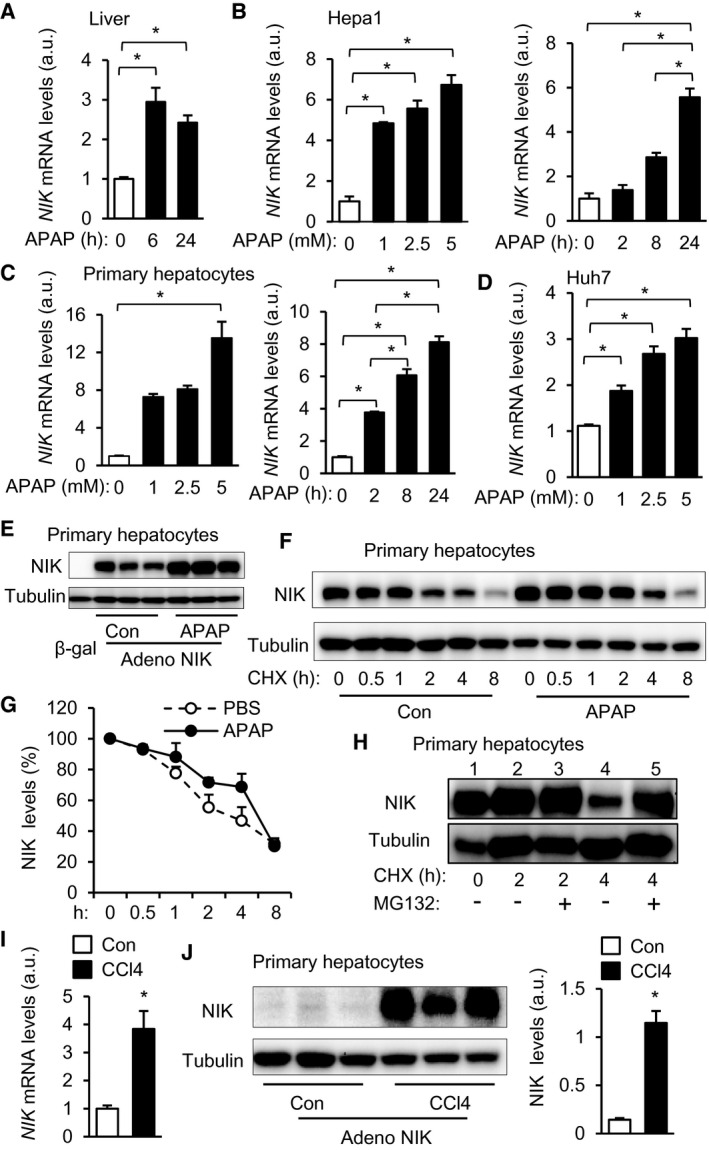
FIG. 1.

APAP and CCl4 treatments up‐regulate hepatic NIK. (A) C57BL/6J male mice were treated with APAP (300 mg/kg body weight). Liver NIK mRNA levels were measured by qPCR and normalized to 36B4 expression (n = 3‐4 per group). (B) NIK mRNA levels in APAP‐treated Hepa1 cells (normalized to 36B4 expression, n = 3 per group). (C) NIK mRNA levels in mouse primary hepatocytes (normalized to 36B4 expression, n = 3 per group). (D) NIK mRNA levels in Huh7 hepatocytes (normalized to GAPDH expression, n = 3 per group). (E) Mouse primary hepatocytes were transduced with NIK or β‐gal adenoviral vectors and treated with APAP or empty vehicles (Con) for 24 hours. Hepatocyte extracts were immunoblotted with antibodies to NIK and α‐tubulin. (F,G) Mouse primary hepatocytes were transduced with NIK adenoviral vectors, pretreated with CHX, and followed by APAP stimulation. Hepatocyte extracts were immunoblotted with the indicated antibodies. NIK levels were normalized to α‐tubulin levels and presented as percentage of initial values (n = 4 per group). (H) Mouse primary hepatocytes were transduced with NIK adenoviral vectors and treated with CHX and MG132. Hepatocyte extracts were immunoblotted with the indicated antibodies. (I) Mouse primary hepatocytes were stimulated with 2 mM CCl4 for 24 hours. NIK mRNA levels were measured by qPCR (normalized to 36B4 levels, n = 3 per group). (J) Mouse primary hepatocytes were transduced with NIK adenoviral vectors and treated with 2 mM CCl4 for 24 hours. Hepatocyte extracts were immunoblotted with the indicated antibodies. NIK levels were normalized to α‐tubulin levels (n = 3 per group). Data are presented as mean ± SEM. *P < 0.05; (A‐D) one‐way ANOVA/Bonferroni’s multiple comparisons test; (G) two‐way ANOVA/Bonferroni’s multiple comparisons test; (I,J) two‐tailed unpaired Student t test. Abbreviations: adeno, adenovirus; GAPDH, glyceraldehyde 3‐phosphate dehydrogenase.
