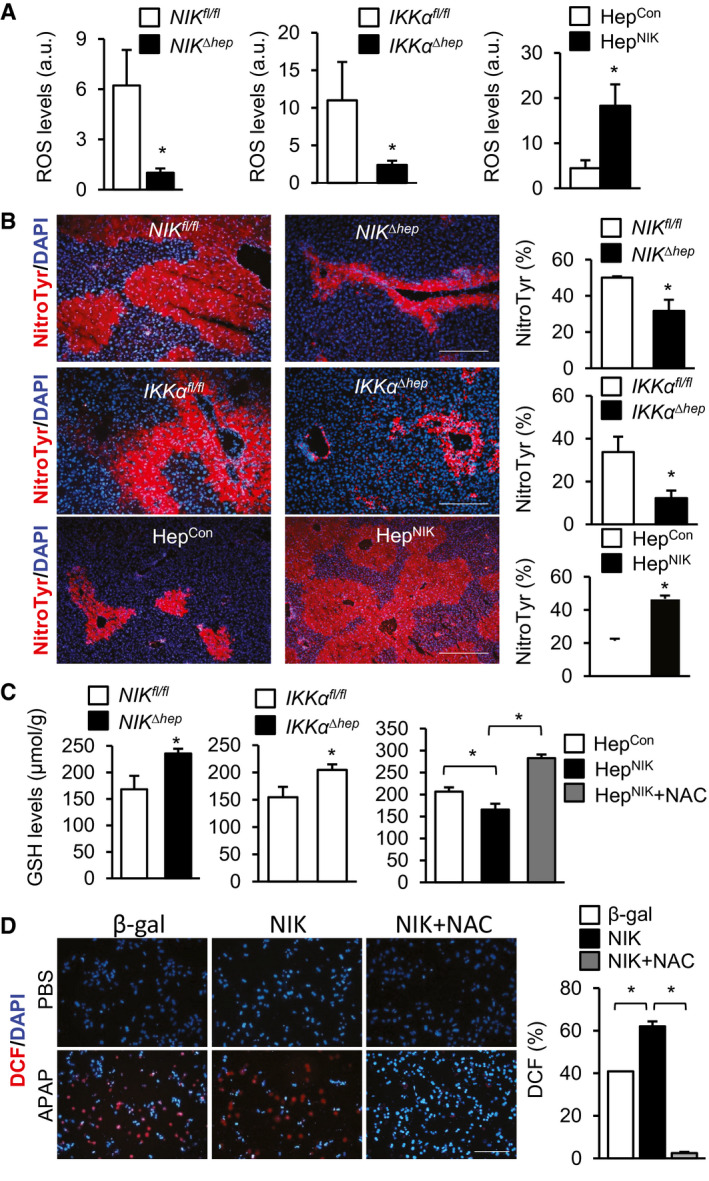
FIG. 5.

NIK increases oxidative stress in hepatocytes. (A‐C) Male mice were treated with APAP for 24 hours. HepNIK and HepCon, 200 mg/kg body weight; NIKΔhep , NIKfl/fl , IKKαΔhep , and IKKαfl/fl , 250 mg/kg. (A) Liver ROS levels (normalized to liver weight). NIKΔhep , n = 7; NIKfl/fl , n = 9; IKKαΔhep , n = 6; IKKαfl/fl , n = 9; HepNIK, n = 4; and HepCon, n = 4. (B) Liver sections were stained with anti‐nitrotyrosine antibody. Nitrotyrosine area was normalized to total area. NIKΔhep , n = 4; NIKfl/fl , n = 4; IKKαΔhep , n = 3; IKKαfl/fl , n = 3; HepNIK, n = 4; and HepCon, n = 4. Scale bar, 200 μm. (C) Liver GSH levels (normalized to liver weight). NIKΔhep , n = 10; NIKfl/fl , n = 10; IKKαΔhep , n = 9; IKKαfl/fl , n = 7; HepNIK, n = 7; HepCon, n = 7; HepNIK+NAC, n = 4. (D) Mouse primary hepatocytes were transduced with NIK or β‐gal adenoviral vectors, pretreated with 500 μM NAC, and followed by 2.5 mM APAP treatment for 24 hours. Hepatocytes were stained with DCF probes. DCF+ cells were normalized to total cells (n = 3 per group). Data are presented as mean ± SEM. *P < 0.05 (A‐C, left two panels) two‐tailed unpaired Student t test. (C, right panel, D) two‐way ANOVA/Bonferroni’s multiple comparisons test. Abbreviation: NitroTyr, nitrotyrosine.
