
FIGURE 2.
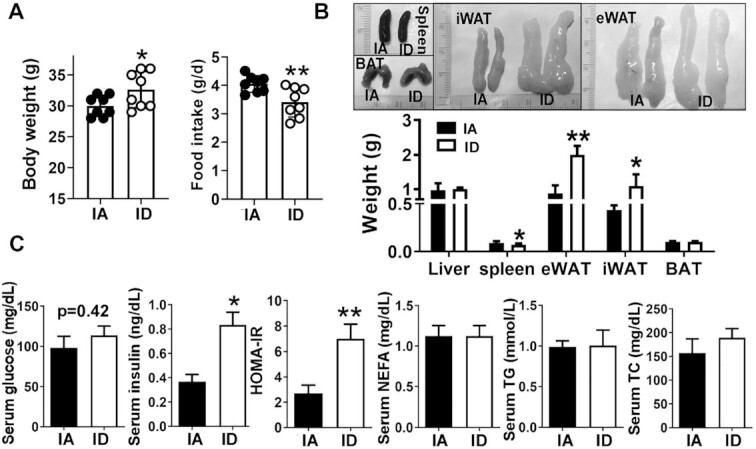
Diet-induced iron deficiency promotes visceral adiposity and insulin resistance. (A) Body weight and food intake. (B) Gross images of different adipose depots (upper) and mass (lower). (C) Fasting blood glucose and insulin concentrations in serum, HOMA-IR index, and lipid profiles in serum; NEFA, TG, and TC. Values are mean ± SD, n = 8. Asterisks indicate the difference from IA, *P < 0.05 and **P < 0.01, by Student t test. BAT, brown adipose tissue; eWAT, epididymal white adipose tissue; IA, iron adequate; ID, iron deficient; iWAT, inguinal white adipose tissue; NEFA, nonesterified fatty acid; TC, total cholesterol; TG, triglyceride.