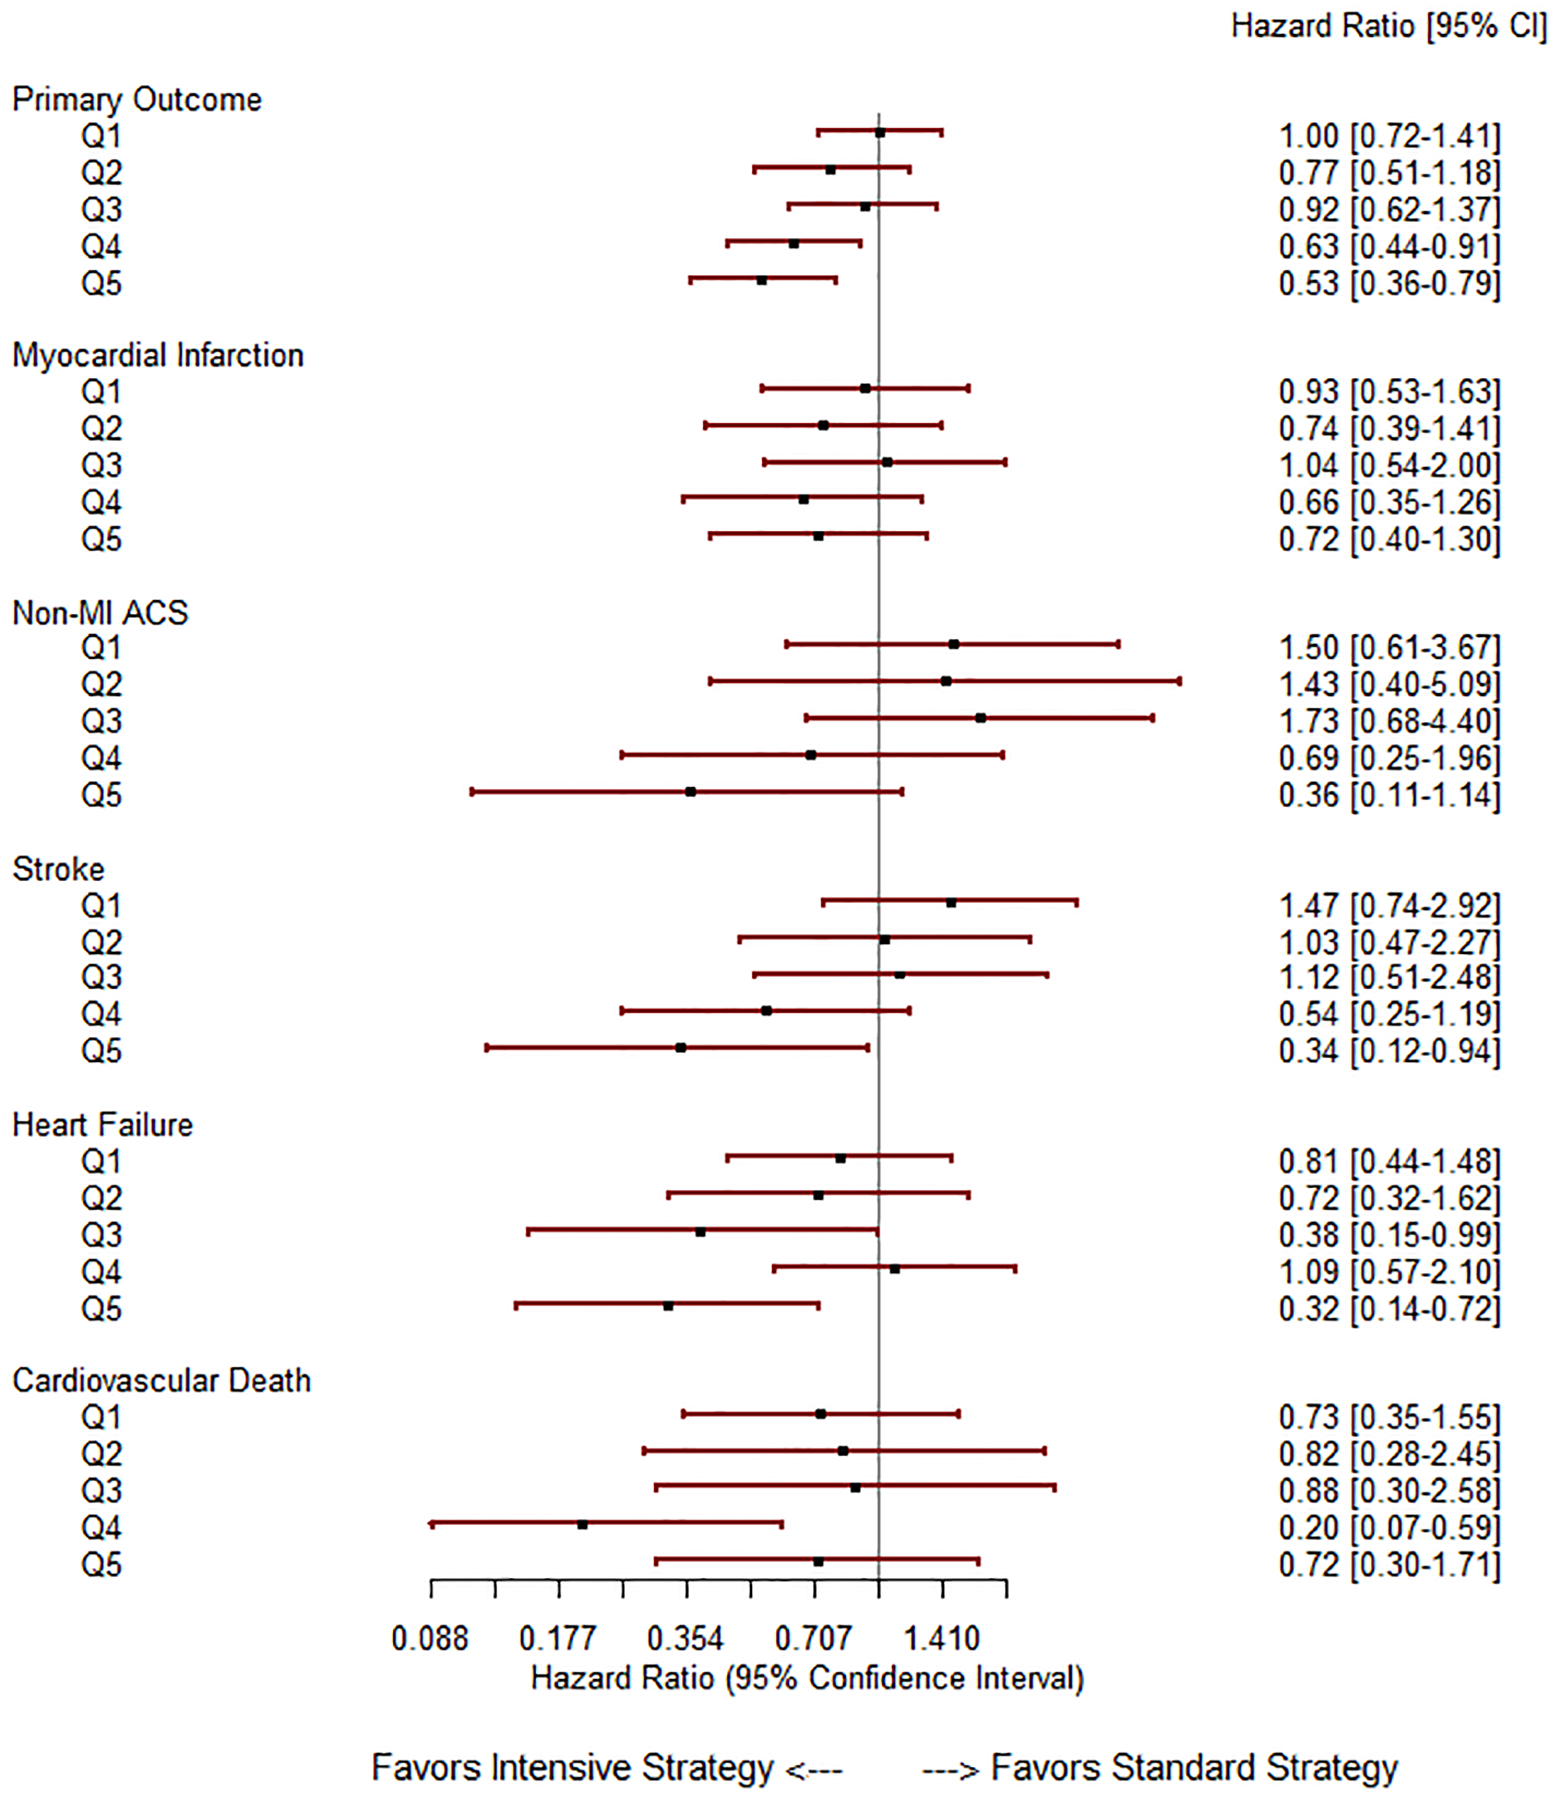
Figure 3:

Forest plot depicting the effect of intensive BP lowering by PM2.5 exposure quintile. Statistical tests for varying effect of treatment by PM2.5 level were performed using Cox PH models and corresponding p-values (for interaction term, PM2.5 (ordinal variable) × study assignment) are displayed in the right-hand column. The solid lines represent no difference in the effect and values to the left of the HR 1.0-line favor intensive BP lowering
