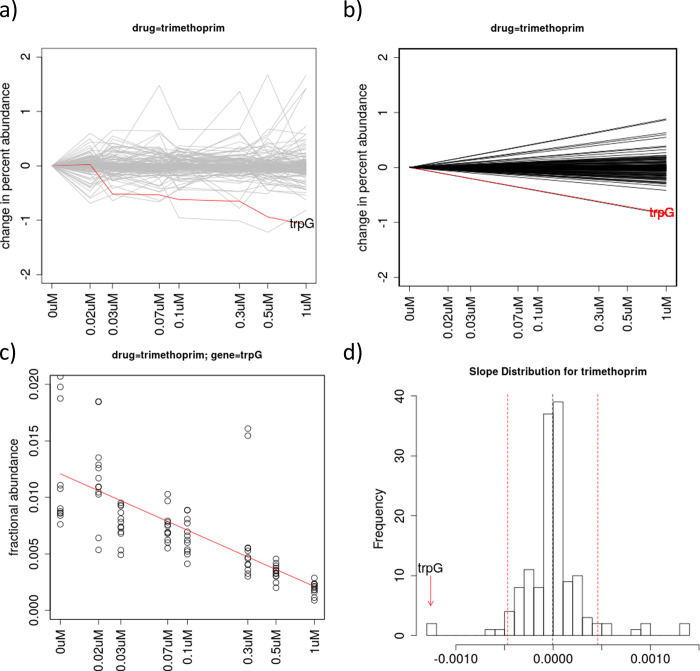
Fig 1. Analysis of data for treatment of an M. tuberculosis hypomorph library with trimethoprim.
(a) Plot of relative abundances of knock-down mutants for all 162 genes in the library, with the known interacting gene trpG highlighted in red, showing depletion as concentration increases. The Y-axis represents the change in percent abundance of each gene, which is calculated by subtracting the mean relative abundance for each gene at 0 μM, so they all fan out from 0 in the superposition. (b) Plot of regression lines for all the genes based on slopes as random-effect coefficients in the linear mixed-model, fit to the abundance data in (a). (c) Plot of relative abundance data points and regression line fit specifically for trpG, as an illustration of the variability of the data among concentrations and replicates. (d) Histogram of the slope coefficients for all genes in the library, with trpG highlighted as an outlier (most negative slope). The dashed red lines indicate the outlier cutoffs defined by Zrobust = ±3.5.

