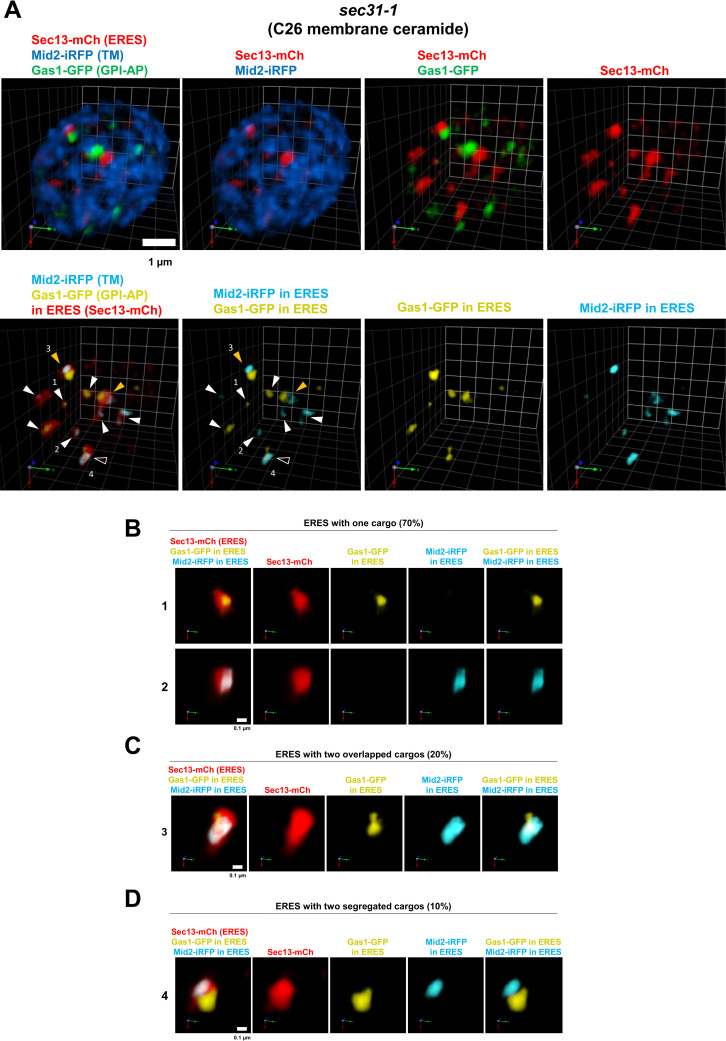
Fig 2. 3D SCLIM visualization of the synchronized incorporation of GPI-anchored and transmembrane cargos into distinct ERES in sec31-1 cells.
sec31-1 temperature-sensitive mutant cells co-expressing galactose-inducible secretory cargos, the GPI-AP Gas1-GFP (green) and the transmembrane (TM) protein Mid2-iRFP (blue), and the constitutive ERES marker Sec13-mCherry (red) were incubated at 37°C for 30 min and then shifted down to 24°C for releasing secretion block and imaged by SCLIM after 20 min with 4 fps as acquisition speed for a single XY 3 color image. 31 Z slices were obtained to acquire a 3D image of 80% of a single yeast cell in 7.75 s. (A) Upper panels show representative merged or individual 3D cell hemisphere images of cargos and ERES marker. Lower panels show processed images to display only the cargo (Gas1-GFP, yellow, and Mid2-iRFP, light blue) present in the ERES (red). White arrowheads: ERES with just one cargo. Open arrowheads: ERES containing two colocalizing cargos. Orange arrowheads: ERES containing two segregated cargos. Scale bar, 1 μm. Scale unit, 0.78 μm. (B, C, D) Enlarged 3D images of selected individual ERES marked in (A). (B) ERES containing only one cargo, Gas1-GFP (1) or Mid2-iRFP (2). (C) ERES containing two overlapped cargos (3). (D) ERES containing two segregated cargos in different zones (4). Scale bar, 0.1 μm.

