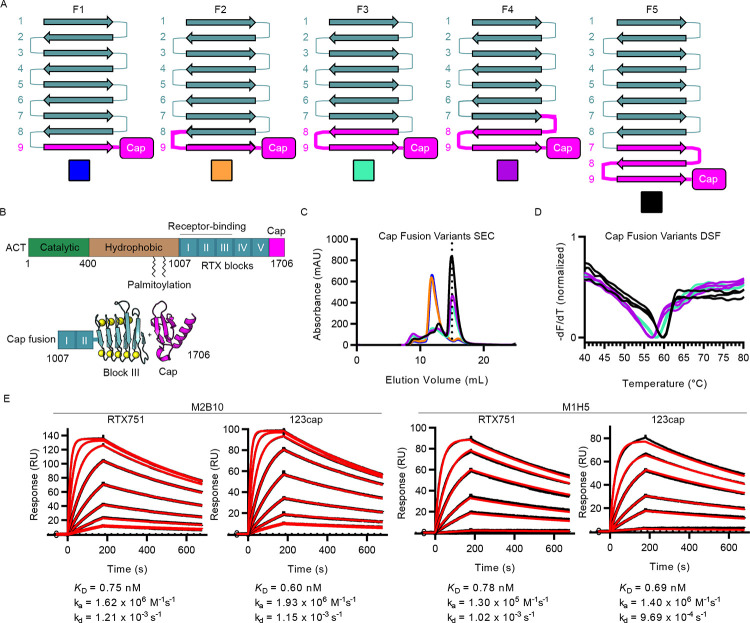
Fig 1. Design and characterization of cap-stabilized RTX domain fragments containing blocks I–III.
(A) Design scheme of fusions between block III and block V cap fragment. RTX repeats from block III and V are represented in terms of their β-strands, numbered by RTX repeat within each RTX block, and their connecting segments, which are mostly Ca2+-binding turns but can contain loop insertions. For each variant, the strands and connecting segments from block III are shown in teal, and those from block V are shown in magenta. (B) Schematic of the ACT gene showing the catalytic domain (green), hydrophobic segment (brown), palmitoylation sites, RTX domain with RTX blocks (teal) and C-terminal cap (magenta). The scheme is shown for fusing the C-terminal cap to a fragment containing RTX blocks I-III, with block III and the C-terminal cap shown in 3D cartoon representation. (C) Size-exclusion chromatography elution profiles for purified cap fusion variants, with colors corresponding to the boxes in A. The dotted line represents the peak elution volume that is consistent with monomeric 123cap. (D) Differential scanning fluorimetry melting profiles for F3, F4, and F5, with data shown as the negative first derivative of the fluorescence intensity. Colors correspond to the boxes in A. (E) Surface plasmon resonance kinetic measurements of M2B10 and M1H5 Fab binding to RTX751 and 123cap. Measured signal for each Fab concentration is shown as a black line, and kinetic fits are shown as red lines. Fit kinetic parameters and equilibrium dissociation constants are shown for each interaction under the corresponding concentration series.

