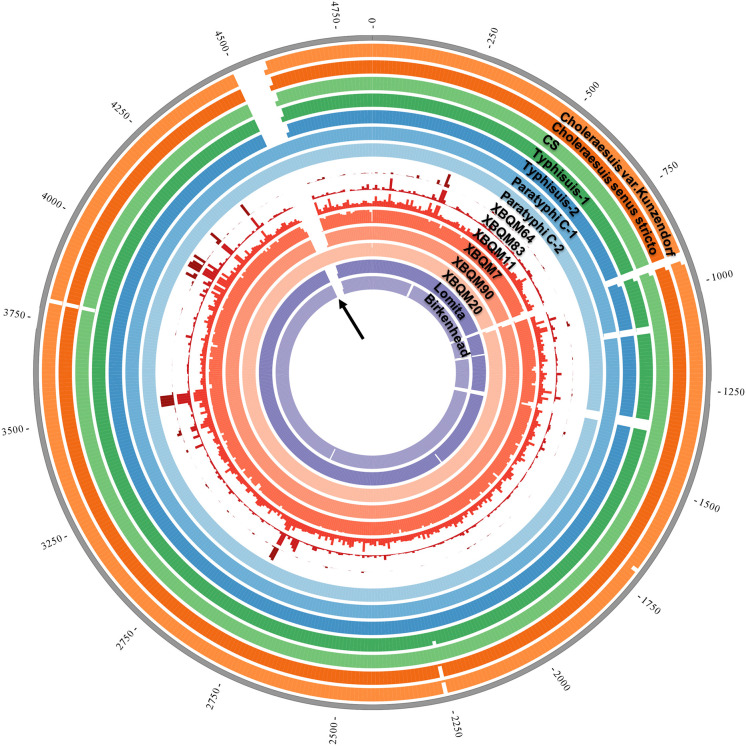
Fig 2. Coverage overview of the modern Para C and XBQ genomes.
The average coverage was calculated for 10kb regions for the chromosome, each ring represents a maximum of 5X coverage. The figure was generated with Circos [80]. The black arrow represents the position of SPI-7.

