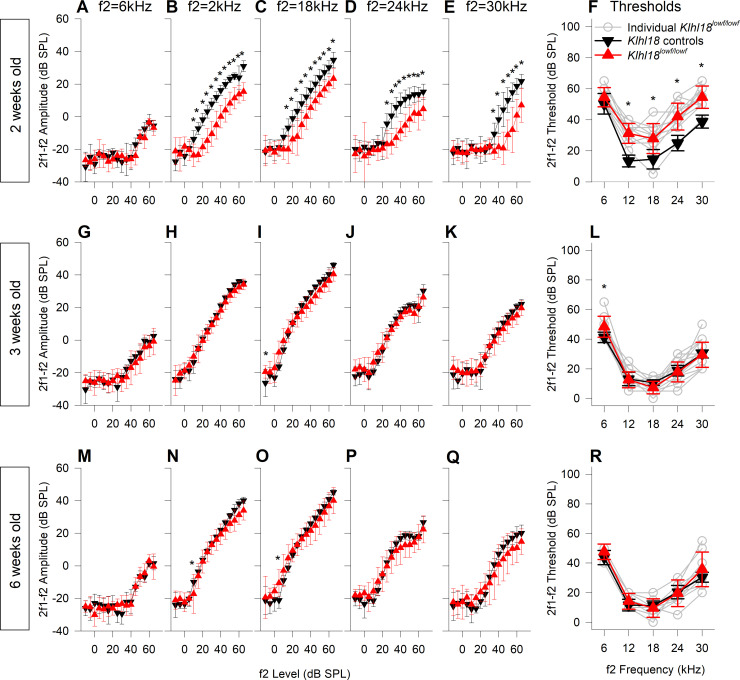
Fig 5. DPOAE growth and thresholds in Klhl18lowf mice.
DPOAE results from mutant mice and heterozygous littermate controls aged 2, 3 and 6 weeks old are plotted in A-F (n = 13 controls, n = 12 mutants), G-L (n = 8 controls, n = 19 mutants) and M-N (n = 9 controls, n = 13 mutants), respectively. Data from control mice are plotted as black down-triangles. Data from mutant mice are plotted as red up-triangles. The mean (±SD) amplitude of the 2f1-f2 DPOAE (dB SPL) is plotted as a function of f2 stimulus level (dB SPL) for f2 frequencies of 6 kHz (A,G,M), 12 kHz (B,H,N), 18 kHz (C,I,O), 24 kHz (D,J,P) and 30 kHz (E,K,Q). Mean threshold (±SD) of the 2f1-f2 DPOAE (derived from individual growth functions, e.g. shown in S2 Fig) and plotted in F, L and R for mice aged 2 weeks, 3 weeks and 6 weeks respectively. In addition to the mean data, thresholds from individual mutant mice are plotted as grey open circles. Results from a mixed-effects model statistical analysis between control and mutant data are shown in S1 Table. Sidak’s multiple comparisons test was used to examine the difference between control and mutant data for each stimulus. Significant differences are indicated here by *.

