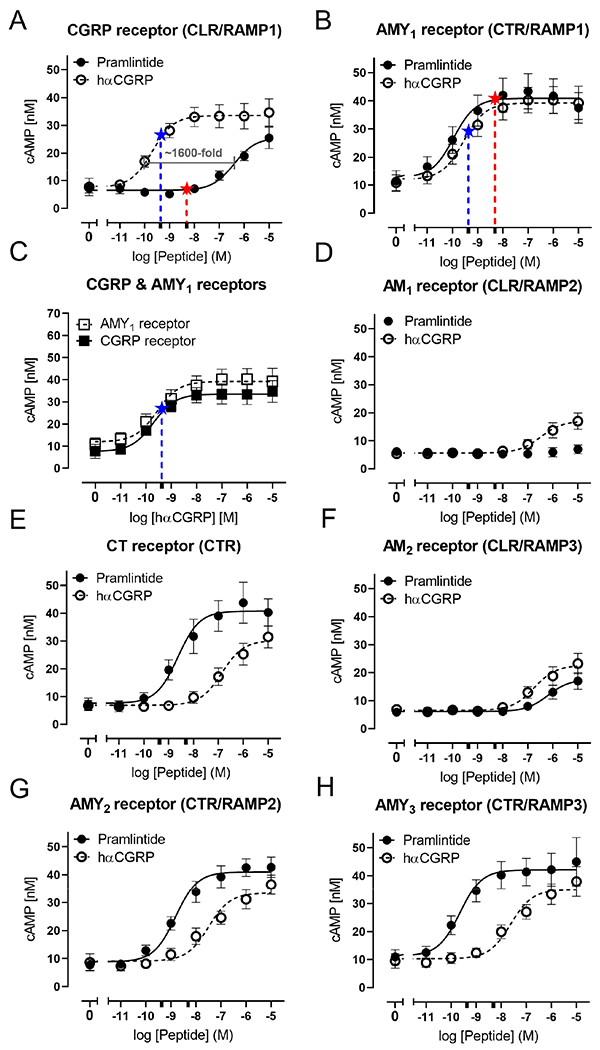
Figure 2. Receptor pharmacology of hαCGRP and pramlintide at human calcitonin family receptors.

A) CGRP receptor, B) AMY1 receptor, C) comparing hαCGRP at CGRP and AMY1 receptors, D) AM1 receptor, E) CT receptor, F) AM2 receptor, G) AMY2 receptor, H) AMY3 receptor. cAMP production from transiently transfected Cos-7 cells in response to each peptide ligand is shown. Data are mean ± SEM. combined from five independent experiments, each with three technical replicates. Adrenomedullin was used to confirm functionality of the AM receptors (data not shown). Stars on A)-C) indicate the mean peak plasma concentration achieved for each peptide in the assays used in this study; pramlintide (4943 pM, red), CGRP (428 pM, blue) marked on the corresponding concentration-response curve. In A)-H) this is also marked for the relevant peptide with an extra tick on the X axis to show the log molar concentration.
