
FIGURE 3.
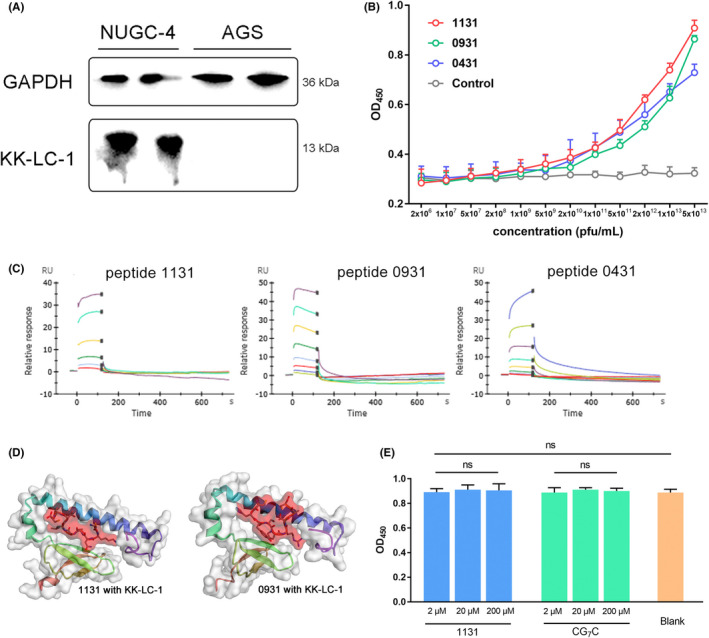
Peptides showed affinity at the molecular level. A, KK‐LC‐1 expression in NUGC‐4 and AGS cells. The NUGC‐4 cell lysate showed a band at 13 kDa, while the AGS cell lysate showed no band. GAPDH was used as an internal reference. B, Phage‐targeting ELISA. The original phage library was used as a control. The affinity of phage clones 1131, 0931, and 0431 was greater than the control when the phage titer was 5 × 10⁹ pfu/mL or higher. In particular, phage clone 1131 showed the best affinity. C, Time‐response curve of BIAcore SPR analysis. The affinities of peptides 1131, 0931 and 0431 were measured respectively. D, Structure of peptides binding with KK‐LC‐1. Red sticks with surface indicate peptides and ribbon cartoon with a gray surface indicate KK‐LC‐1. E, Cytotoxicity experiments of 1131 and CG7C. Peptide 1131 showed no cytotoxicity to NUGC‐4 cells in 2, 20 and 200 μmol/L compared with CG7C control and blank. ns, not significant