
FIGURE 2.
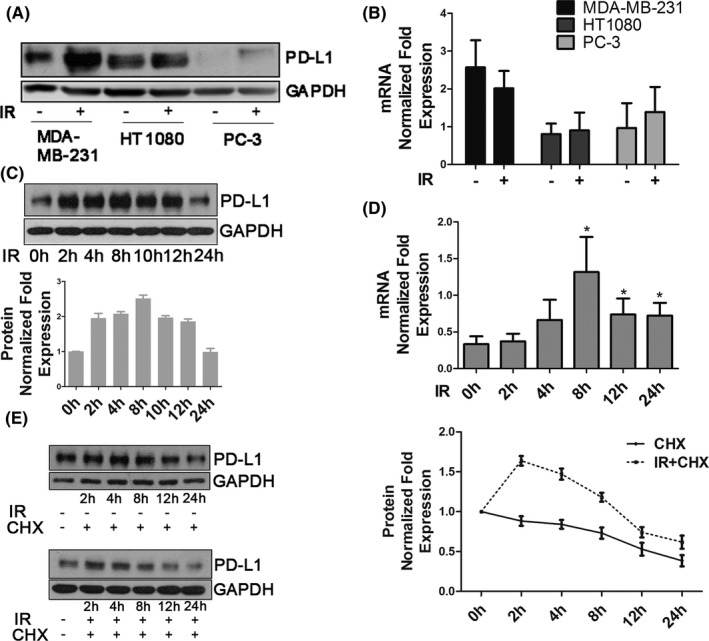
Ionizing radiation increases PD‐L1 expression of cancer cells at the transcriptional and post‐translational levels. A, PD‐L1 protein expression and (B) PD‐L1 mRNA expression were examined in MDA‐MB‐231, HT1080, and PC‐3 cells 2 h after 5 Gy IR. C, PD‐L1 protein expression was examined in MDA‐MB‐231 cells at the indicated time points after 5 Gy IR. Quantification of bands using ImageJ software for PD‐L1 expression is shown in the bar chart below. Error bars are expressed as mean ± SD of 3 independent experiments. D, PD‐L1 mRNA expression was examined in MDA‐MB‐231 cells at the indicated time points after 5 Gy IR. E, Protein stability of PD‐L1 in MDA‐MB‐231 cells. Cells were treated with 20 µM cycloheximide (CHX) at indicated intervals with or without IR (5 Gy) and analyzed by western blot (left). Quantification of bands for PD‐L1 expression is shown as a line graph on the right. Error bars are expressed as mean ± SD of 3 independent experiments