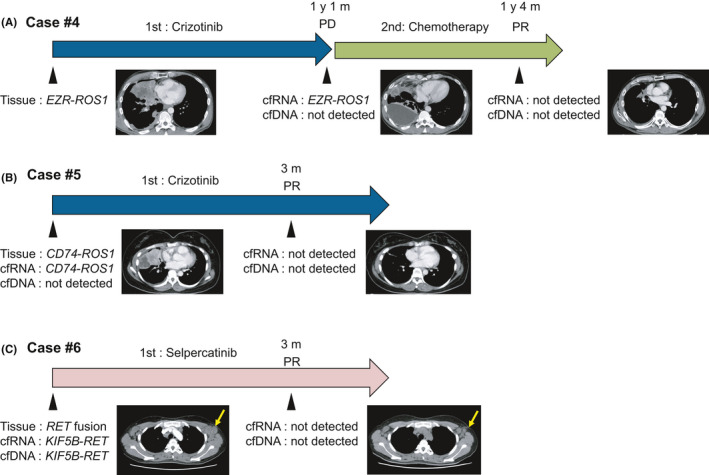
FIGURE 4.

Representative cases of liquid biopsy at multiple time points. The cfRNA‐based assay was performed during treatment to monitor disease status. The arrows indicate the treatment courses and the arrowheads indicate the timings of sample collection and computed tomography scanning. (A), EZR‐ROS1 fusion was detected in cfRNA but not cfDNA when the patient exhibited PD to first‐line treatment with crizotinib. After 3 mo of second‐line chemotherapy, when the patient exhibited PR, the EZR‐ROS1 fusion gene was not detected with the RNA‐based assay. (B), The CD74‐ROS1 fusion was detected with the cfRNA‐based assay before treatment initiation and then was negative after 3 mo of treatment when the patients exhibited PR. (C), The KIF5B‐RET fusion was detected by both cfRNA‐based and cfDNA‐based assays before treatment initiation and switching to negative after 3 mo of treatment when the patients exhibited PR. The yellow arrows indicate tumor shrinkage
