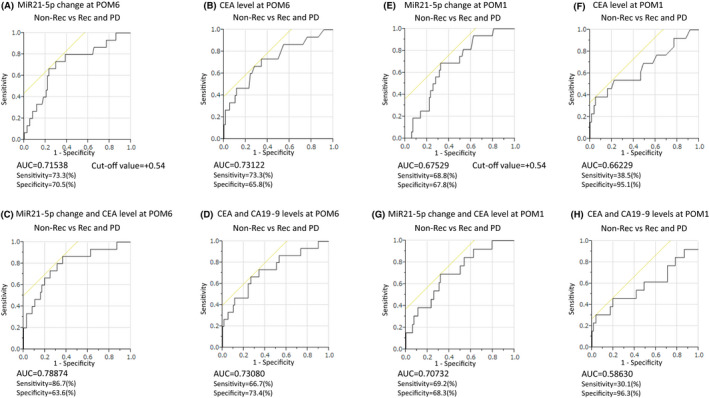
FIGURE 3.

Receiver operating characteristics (ROC) curve analysis of postoperative change in plasma miR21‐5p level and tumor markers (carcinoembryonic antigen [CEA] and carbohydrate antigen 19‐9 [CA19‐9]) levels at POM6 and POM1 for discriminating to recurrence and PD after surgical resection. Postoperative changes in plasma miR21‐5p level at POM6 yielded an area under curve (AUC) of 0.715 with 73.3% sensitivity and 70.5% specificity (A), and CEA level at POM6 yielded an AUC of 0.731 (B). Combined ROC analysis revealed that the combination of miR21‐5p and CEA on POM6 yielded an AUC of 0.788 with 86.7% sensitivity and 63.6% specificity (C), and the combination of CEA and CA19‐9 at POM6 yielded an AUC of 0.730 (D). Postoperative changes in plasma miR21‐5p level at POM1 yielded an AUC of 0.675 with 68.8% sensitivity and 67.8% specificity (E), and CEA level at POM1 yielded an AUC of 0.662 (F). Combined ROC analysis revealed that the combination of miR21‐5p and CEA on POM1 yielded an AUC of 0.707 with 69.2% sensitivity and 68.3% specificity (G), and the combination of CEA and CA19‐9 at POM1 yielded an AUC of 0.586 (H). Youden's index was used to determine the optimal cut‐off point to calculate the specificities and sensitivities in the ROC analysis
