FIGURE 2.

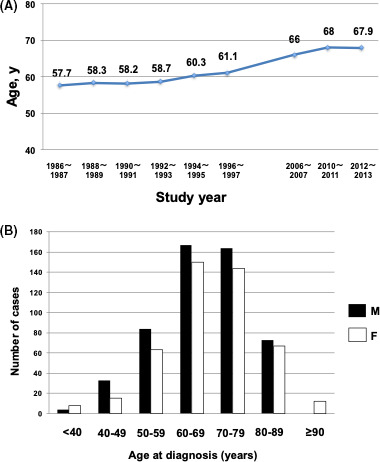
Age distribution of patients with adult T‐cell leukemia‐lymphoma. A, Mean age at diagnosis of patients by year of diagnosis from the 1980s to the present study. B, Age distribution of patients in the present study by sex

Age distribution of patients with adult T‐cell leukemia‐lymphoma. A, Mean age at diagnosis of patients by year of diagnosis from the 1980s to the present study. B, Age distribution of patients in the present study by sex