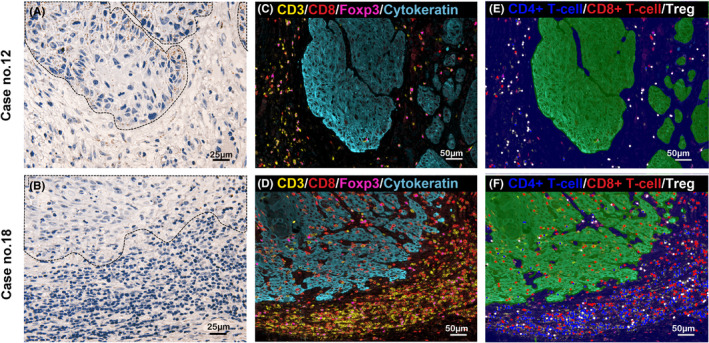
FIGURE 8.

Representative images of RNA‐ISH of TGF‐β1 and MF‐IHC of immune cells. Representative cases of high (case 12; A) and low (case 18; B) expression of TGFB1 mRNA in the tumor nests are shown, respectively (×400 magnification). The area surrounded by dotted lines indicates the tumor nest. Tiny brown dots indicate TGFB1 mRNA expression. The distribution of T‐cells by MF‐IHC of the same area as (A) and (B) are shown in (C) and (E), and (D) and (F), respectively (×200 magnification). The MF‐IHC is indicated by red circles for CD8+ T‐cells, blue circles for CD4+ T‐cells, and white circles for Tregs (E, F)
