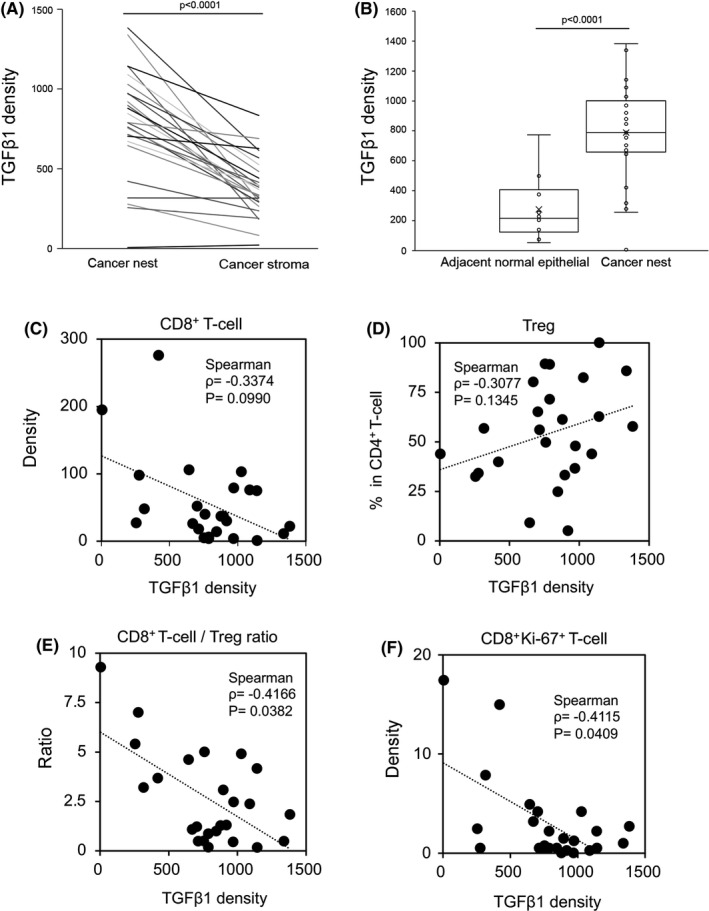
FIGURE 9.

Comparison of TGFB1 mRNA distribution within OSCC tissues and correlation of TGFB1 mRNA expression with T‐cell infiltration. Comparison of TGF‐β1 density in the cancer nests and cancer stroma in the same tissue (A). Comparison of TGF‐β1 density in adjacent normal epithelium and cancer nests (B). Correlation between TGF‐β1 density and CD8+ T‐cell density (C), TGF‐β1 density and Ki‐67+CD8+ density (D), TGF‐β1 density and the percentage of Tregs in CD4+ T‐cells (E), and TGF‐β1 density and CD8+ T‐cell/Treg ratio (F)
