FIGURE 6.

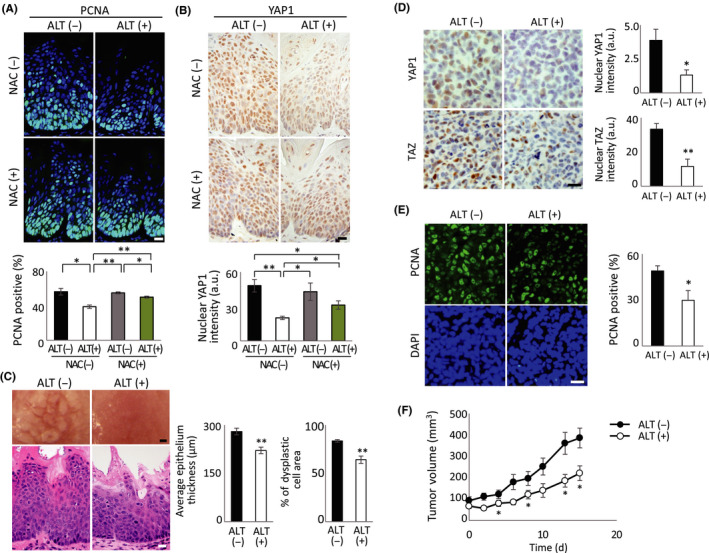
Alantolactone (ALT) reduces tumor growth in a YAP1‐dependent tongue cancer model and a xenograft tumor model. A, B, tgMob1 double knockout (DKO) mice received daily injection of 20 mg/kg ALT i.p. or vehicle control (50 μL DMSO) for a total of 13 d starting at 3 d before tamoxifen (Tmx) application to the tongue. N‐acetylcysteine (NAC) treatment was started at 5 d before Tmx application. Mice were killed at 10 d post‐Tmx. Upper panels: Mouse tongue sections were analyzed for (A) proliferation by proliferating cell nuclear antigen (PCNA) staining and (B) YAP1 protein expression by immunostaining. Mouse numbers were: ALT (−) NAC (−), n = 4; ALT (−) NAC (+), n = 3; ALT (+) NAC (−), n = 4; and ALT (+) NAC (+), n = 5. Scale bar = 20 μm. Lower left panel: Quantification of percentages of PCNA‐positive cells in tongue sections in upper left panel. Data are mean ± SEM. Lower right panel: Quantification of relative intensity of nuclear YAP1 staining in cells in upper right panel. Data are mean ± SEM. a.u., arbitrary units. C, Left panels: Macroscopic views (top) and H&E‐stained sections (bottom) of tongues of tgMob1 DKO mice that received daily injection of 20 mg/kg ALT i.p. (n = 10) or vehicle control (50 μL DMSO; n = 8) for a total of 17 d starting at 3 d before Tmx application. Tongue tissues were sectioned after 2 wk of treatment with ALT or DMSO. Scale bar = 200 μm (top) and 20 μm (bottom). Middle and right panels: Quantification of thickness of epithelial layer (middle) and area of dysplastic cells in this layer expressed as a percentage (right; n = 10 different sites/sample). Data are mean ± SEM. *P < .05. D, MDA‐MB‐231 cells were xenografted s.c. into nude mice. After 10 d, mice were injected with 5 mg/kg ALT i.p. (n = 9) or vehicle control (100 μL DMSO; n = 10) for 15 d, after which xenografted tumor tissues were sectioned. Left panels: Immunostaining to detect nuclear YAP1 and TAZ in xenografted tumor tissues. Scale bar = 10 μm. Right panels: Quantification of intensities of nuclear YAP1 and TAZ staining in left panels. Data are mean ± SEM. E, Left panels: PCNA (top) and DAPI (bottom) staining of xenografted tumor tissues in (D). Scale bar = 10 μm. Right panels: Quantification of percentage of PCNA‐positive cells in tissues in left panels. Data are mean ± SEM. F, Quantification of xenograft tumor volumes in ALT‐treated (ALT (+), n = 9) and DMSO‐treated (ALT (−), n = 10) mice in (D). Tumor volumes were measured every second day. Data are mean ± SEM. *P < .05, **P < .01.
