FIGURE 3.

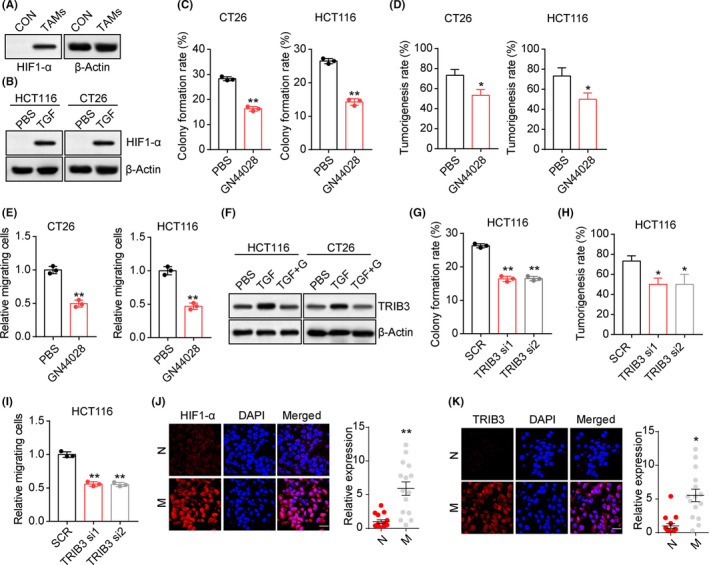
Transforming growth factor‐β (TGF‐β) upregulated hypoxia‐induble factor 1α (HIF1α) to promote Tribbles pseudokinase 3 (TRIB3) expression. A, Western blotting of HIF1α in HCT116 cells cocultured with tumor‐associated macrophages (TAMs) or not (CON). B, Western blotting of HIF1α in HCT116/CT26 cells treated with PBS or TGF‐β (100 ng/mL). C, Colony formation rates of TGF‐β (100 ng/mL) cultured CT26/HCT116 cells treated with PBS or GN44028 (20 nmol/L). D, Tumorigenesis capability of TGF‐β (100 ng/mL) cultured CT26/HCT116 cells treated with PBS or GN44028 (20 nmol/L). E, Numbers of relative migrating TGF‐β (100 ng/mL) cultured CT26/HCT116 cells treated with PBS or GN44028 (20 nmol/L). F, Western blotting of TRIB3 in CT26/HCT116 cells treated with TGF‐β (100 ng/mL) combined with PBS or GN44028 (20 nmol/L) (TGF+G). G, Colony formation rates of TGF‐β (100 ng/mL) cultured HCT116 cells treated with scramble RNA (SCR) or TRIB3 siRNA. H, Tumorigenesis capability of TGF‐β (100 ng/mL) cultured HCT116 cells treated with scramble RNA or TRIB3 siRNA. I, Numbers of relative migrating TGF‐β (100 ng/mL) cultured HCT116 cells treated with SCR or TRIB3 siRNA. J, Immunofluorescence staining of HIF1α in tumor tissues from metastasis (M) and nonmetastasis (N) colorectal cancer patients. Intensity of HIF1α expression was determined in 30 tumor tissues. Scale bar, 30 μm. K, Immunofluorescence staining of TRIB3 in tumor tissues from M and N colorectal cancer patients. Intensity of TIRIB3 expression was determined in 30 tumor tissues. Scale bar, 30 μm. *P < .05; **P < .01
