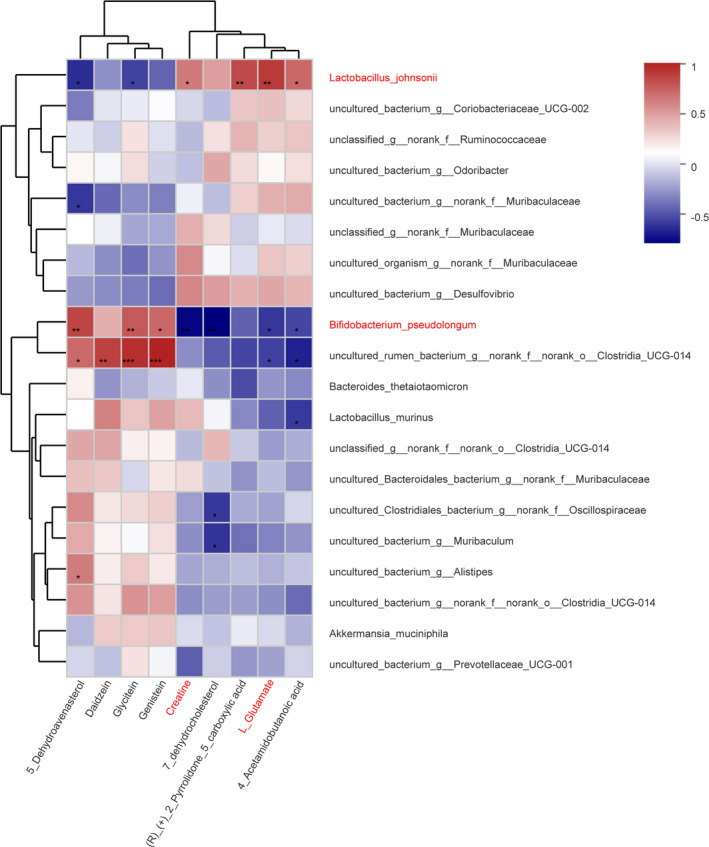
FIGURE 7.

Correlation between changes of abundance in fecal metabolites and gut microbiota. Nine fecal metabolites were selected. The heat map shows the Spearman correlation coefficient between changes in these metabolite concentrations and changes in relative abundance of species. The intensity of the colors represents the degree of positive or negative association. *P < .05, **P < .01, ***P < .001
