
FIGURE 2.
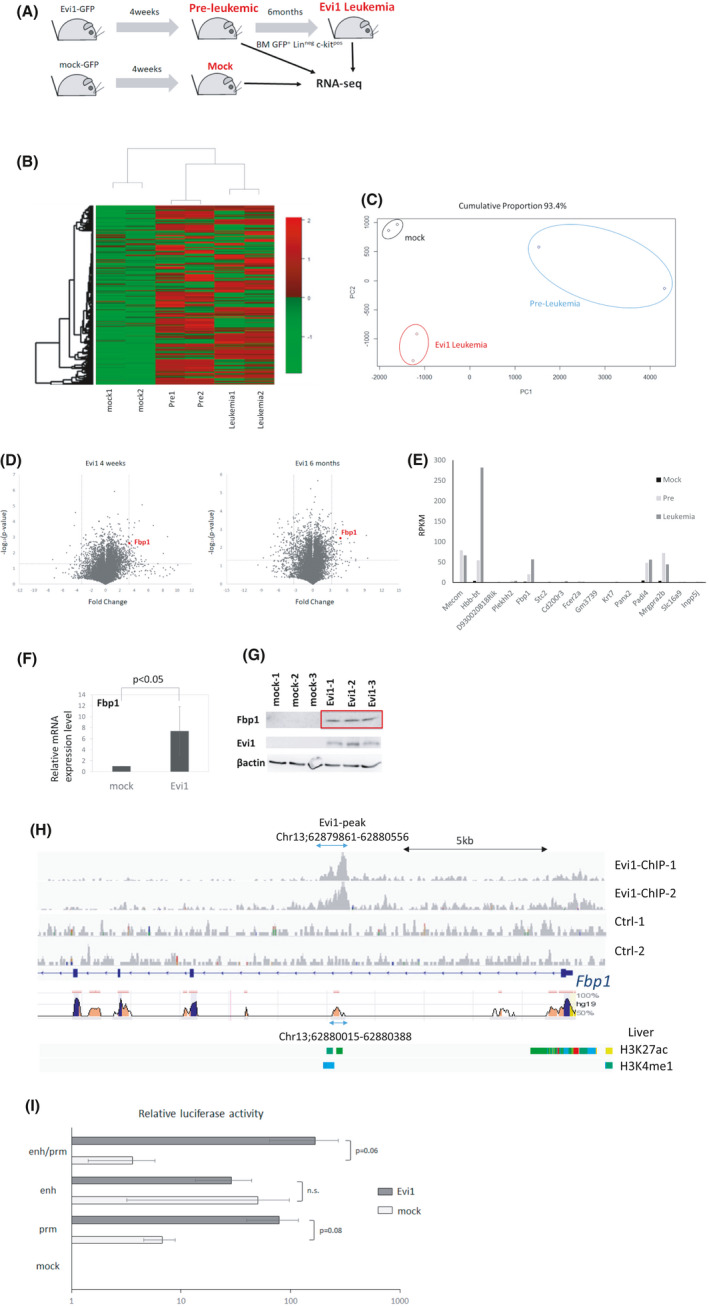
Evi1 upregulates Fbp1 expression. (A) Schematic representation of sample preparation for RNA‐seq analysis. Evi1‐GFP or GFP‐transduced cells were transplanted to sublethally irradiated mice. GFPpos, Linneg, c‐kitpos bone marrow cells were isolated at 4 weeks (pre‐leukemic phase) and 6 months (leukemic phase) after transplantation and subjected to RNA‐seq analysis (n = 2 in each experiment). (B) Unsupervised hierarchical clustering of differentially expressed genes among the three types of the cells. (C) Principle component analysis of RNA‐seq result. (D) Volcano plot comparing mRNA expression of Evi1‐overexpressing bone marrow LK cells at 4 weeks to control cells (left) or leukemia cells at 6 months to control cells (right). Fbp1 is highlighted as a red dot. (E) RPKM of 15 genes highly upregulated in Evi1‐overexpressing bone marrow cells at 4 weeks and at 6 months (F) Relative mRNA expression of Fbp1 in KSL cells retrovirally transduced with Evi1. Error bars indicate SD (n = 3, unpaired t test). (G) Western blot analysis of Fbp1 and EVI1 of whole cell lysates from mouse LK cells transduced with mock or EVI1‐FLAG retroviral vector. (H) EVI1‐FLAG ChIP‐seq signals in Fbp1 locus in mouse Evi1‐overexpressing leukemia cells. Regions conserved between mouse and human are shown at the bottom. (I) Luciferase activity of Fbp1 promoter and/or enhancer with or without Evi1 overexpression in 293T cells. Values are normalized to values using 293T cells transfected with empty luciferase vector (n = 3 in each, unpaired t test). prm, promoter; enh, enhancer; prm/enh, promoter and enhancer; emp, empty