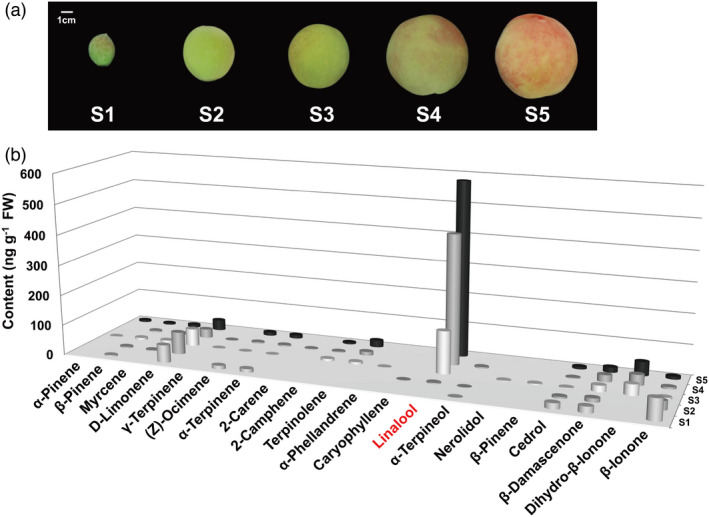
Figure 1.

Changes in volatiles during peach fruit development and ripening. (a) Photo of peach fruit cv Hujingmilu at different stages: S1 (34 days after bloom, DAB), S2 (71 DAB), S3 (94 DAB), S4 (108 DAB) and S5 (111 DAB). Bars = 1 cm. (b) Volatile content of peach fruit. Averaged data from three biological replicates are shown. Standard errors are presented in Table S1.
