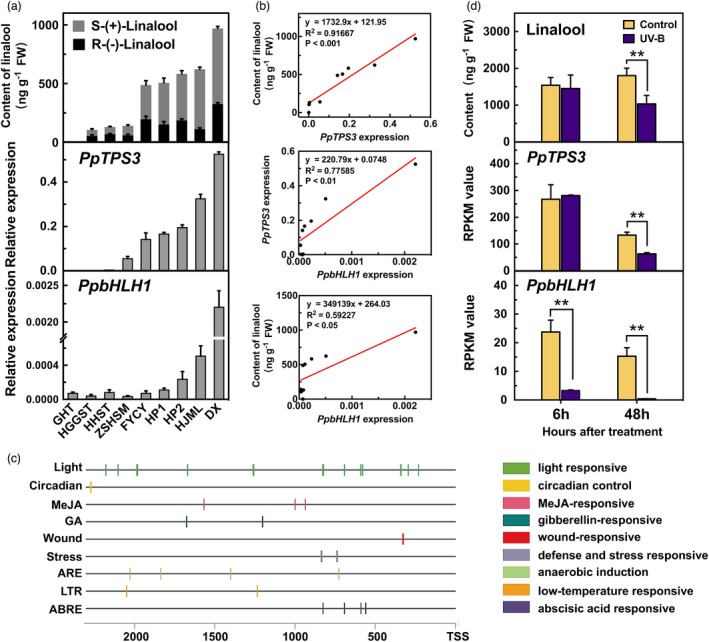
Figure 5.

Correlation between transcript levels of PpbHLH1, PpTPS3 and contents of linalool in peach fruit. (a) Content of linalool and expression levels of PpTPS3 and PpbHLH1 across peach cultivars. (b) Correlation analysis between content of linalool and expression levels of PpTPS3 and PpbHLH1 across peach cultivars. (c) Analysis of cis‐acting elements of PpbHLH1 2kb promoter sequence based on the PlantCARE database. (d) Effect of UV‐B light treatment on content of linalool and expression levels of PpTPS3 and PpbHLH1 in peach fruit. Relative expression levels were determined using RT‐qPCR. Data are presented as mean ± standard error from three independent biological replicates. Significant differences are indicated with asterisks above the bars (**, P < 0.01).
