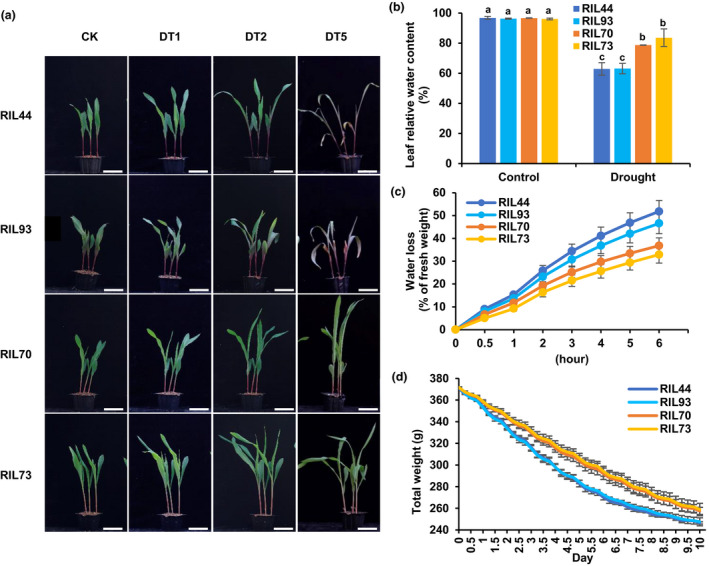
Figure 1.

The physiological characteristics of four different lines in response to drought stress. (a) Phenotypic changes of four lines during drought treatment. CK, DT1, DT2, and DT5 refer to drought treatment for 0, 1, 2 and 5 days, respectively. Bar = 5 cm. (b) Leaf relative water content. The leaves were collected when the soil moisture content was about 86% (control) and 12% (drought). Statistical significance was determined by one‐way ANOVA Duncan’s multiple range tests (P < 0.05). (c) Water loss rates of detached leaves. (d) Water loss rates of the whole seedlings during drought treatment. Y‐axis represents the total weight of pots, soil and seedlings. Error bars, s.d., calculated from the results of at least three independent experiments.
