
Figure 2.
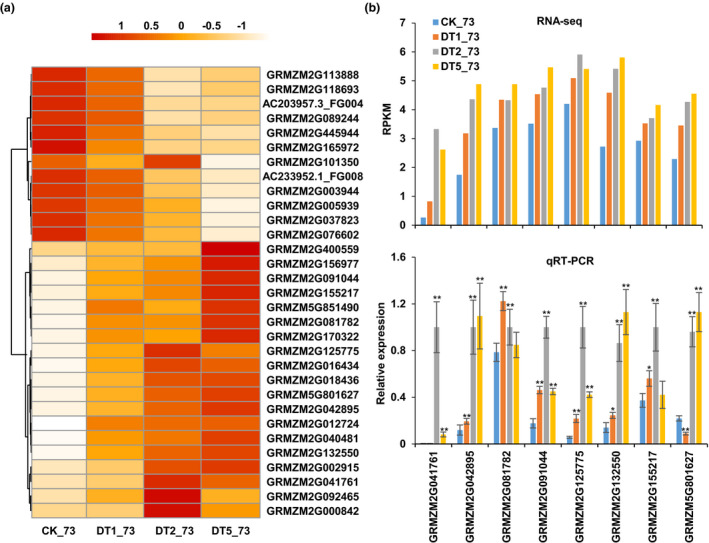
Differentially expressed transcription factors in specific regions from RIL73. (a) Heat map of transcription factors with differential expression in specific regions. Colour was determined by Z score. (b) Validation of RNA‐seq results by qRT‐PCR. The top half is the result of RNA‐seq, the bottom half is the result of qRT‐PCR. RPKM: Reads Per Kilobase per Million mapped reads. Error bars, s.d., calculated from the results of at least three independent experiments. Statistical significance compared with CK was determined by a two‐sided t‐test: *P < 0.05, **P < 0.01.