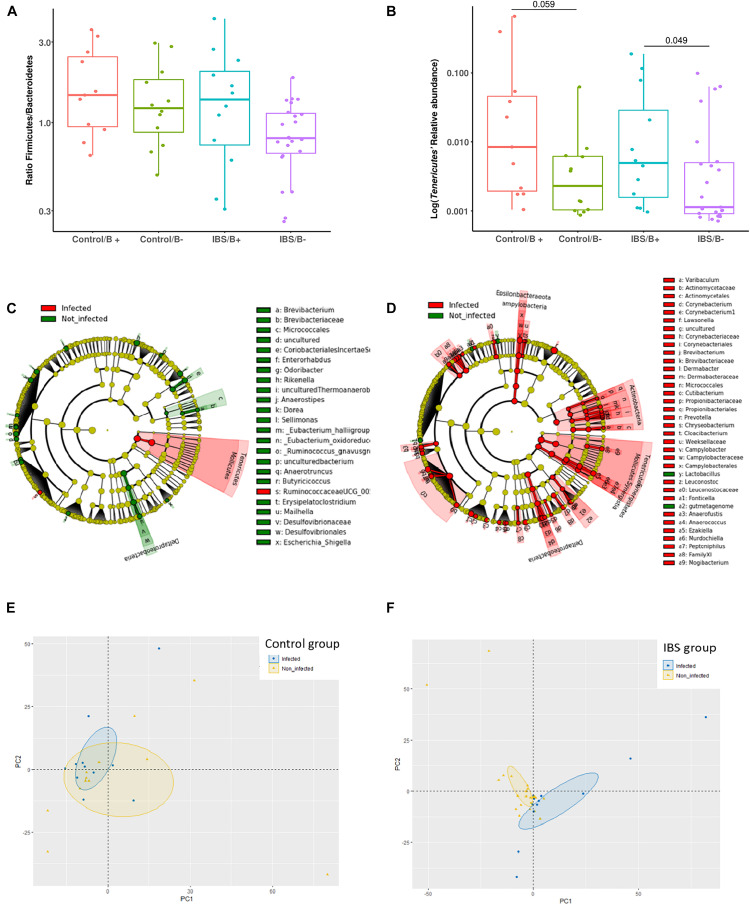
FIGURE 3.
Investigations about bacterial phyla/members that drive differences in each group of patients according to Blastocystis carriage. (A,B) Analysis at the phyla level: (A) Firmicutes/Bacteroidetes ratio in controls and IBS according to Blastocystis carriage. (B) Relative abundance of Tenericutes. Statistical significance was determined by Mann–Whitney test. Significant (or close to significance) p-values were reported on boxplots. IBS/B-: Blastocystis-negative IBS patients; IBS/B + : Blastocystis-positive IBS patients; Control/B-: Blastocystis-negative control subjects; Control/B + : Blastocystis-positive control subjects. (C,D) LefSe (LDA Effect Size) analysis in the control group (C) and the IBS group (D). Red, taxa higher in Blastocystis-infected subjects; green, taxa higher in non-Blastocystis-infected subjects. Statistical significance was determined by LefSe analysis with FDR correction (only those species with q values < 0.05 and LDA effect size > 2 are shown). (E,F) Beta diversity analysis: PCoA of the unweighted UniFrac distance of non-carriers (yellow plots) and carriers (blue plots) of Blastocystis in the control group (E) and the IBS group (B).

