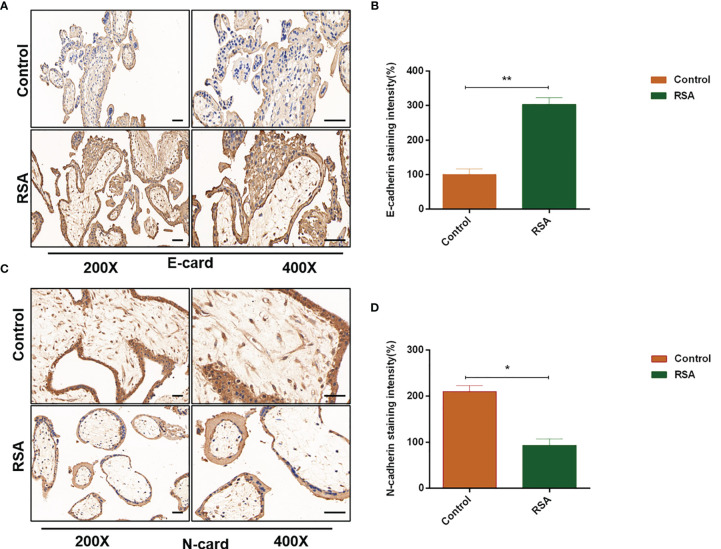
Figure 5.
Expression of E-cadherin and N-cadherin in human placental villous tissues from the RSA group and the control group. Placental villous tissues from women with RSA (n = 15) and normal controls (n = 13) were used for the IHC assay. (A, B) Representative immunohistochemical staining images and quantification of E-cadherin in the RSA group (n = 15) and normal group (n = 13). (C, D) Representative immunohistochemical staining images and quantification of N-cadherin in the RSA group (n = 15) and normal group (n = 13). The staining intensity is quantified using ImageJ. Magnification, ×200 and ×400. Scale bars = 100 μm. Graphs show the mean ± SD. Results are reported as fold change compared with the control group (*p < 0.05, **p < 0.01). RSA, recurrent spontaneous abortion; IHC, immunohistochemistry.

