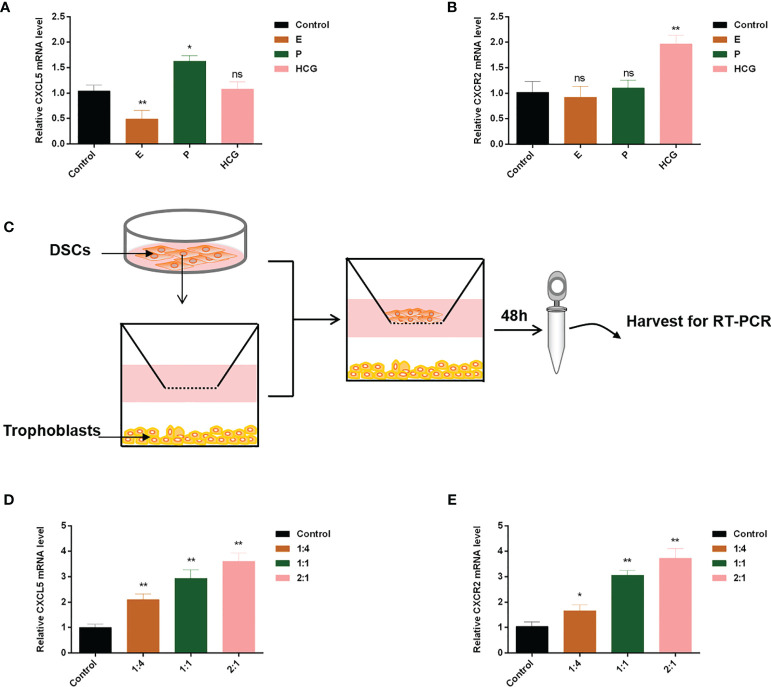
Figure 6.
E, P, HCG, and DSCs regulate CXCL5/CXCR2 expression of trophoblast cells. HTR-8 cells were treated with E, P, and HCG at the indicated concentrations for 48 h. (A, B) RT-PCR was used to detect the expression levels of CXCL5 and CXCR2. (C) A co-culture system of HTR-8 cells and DSCs was taken for 48 h. (D, E) RT-PCR was used to investigate the impact of DSCs on CXCL5 and CXCR2 expression of trophoblast cells. Graphs show the mean ± SD. Results are reported as fold change compared with the control group (*p < 0.05, **p < 0.01, ns, no significant difference, p > 0.05). E, estrogen; P, progesterone; HCG, human chorionic gonadotropin; DSCs, decidual stromal cells; RT-PCR, quantitative real-time PCR.

