
Figure 1.
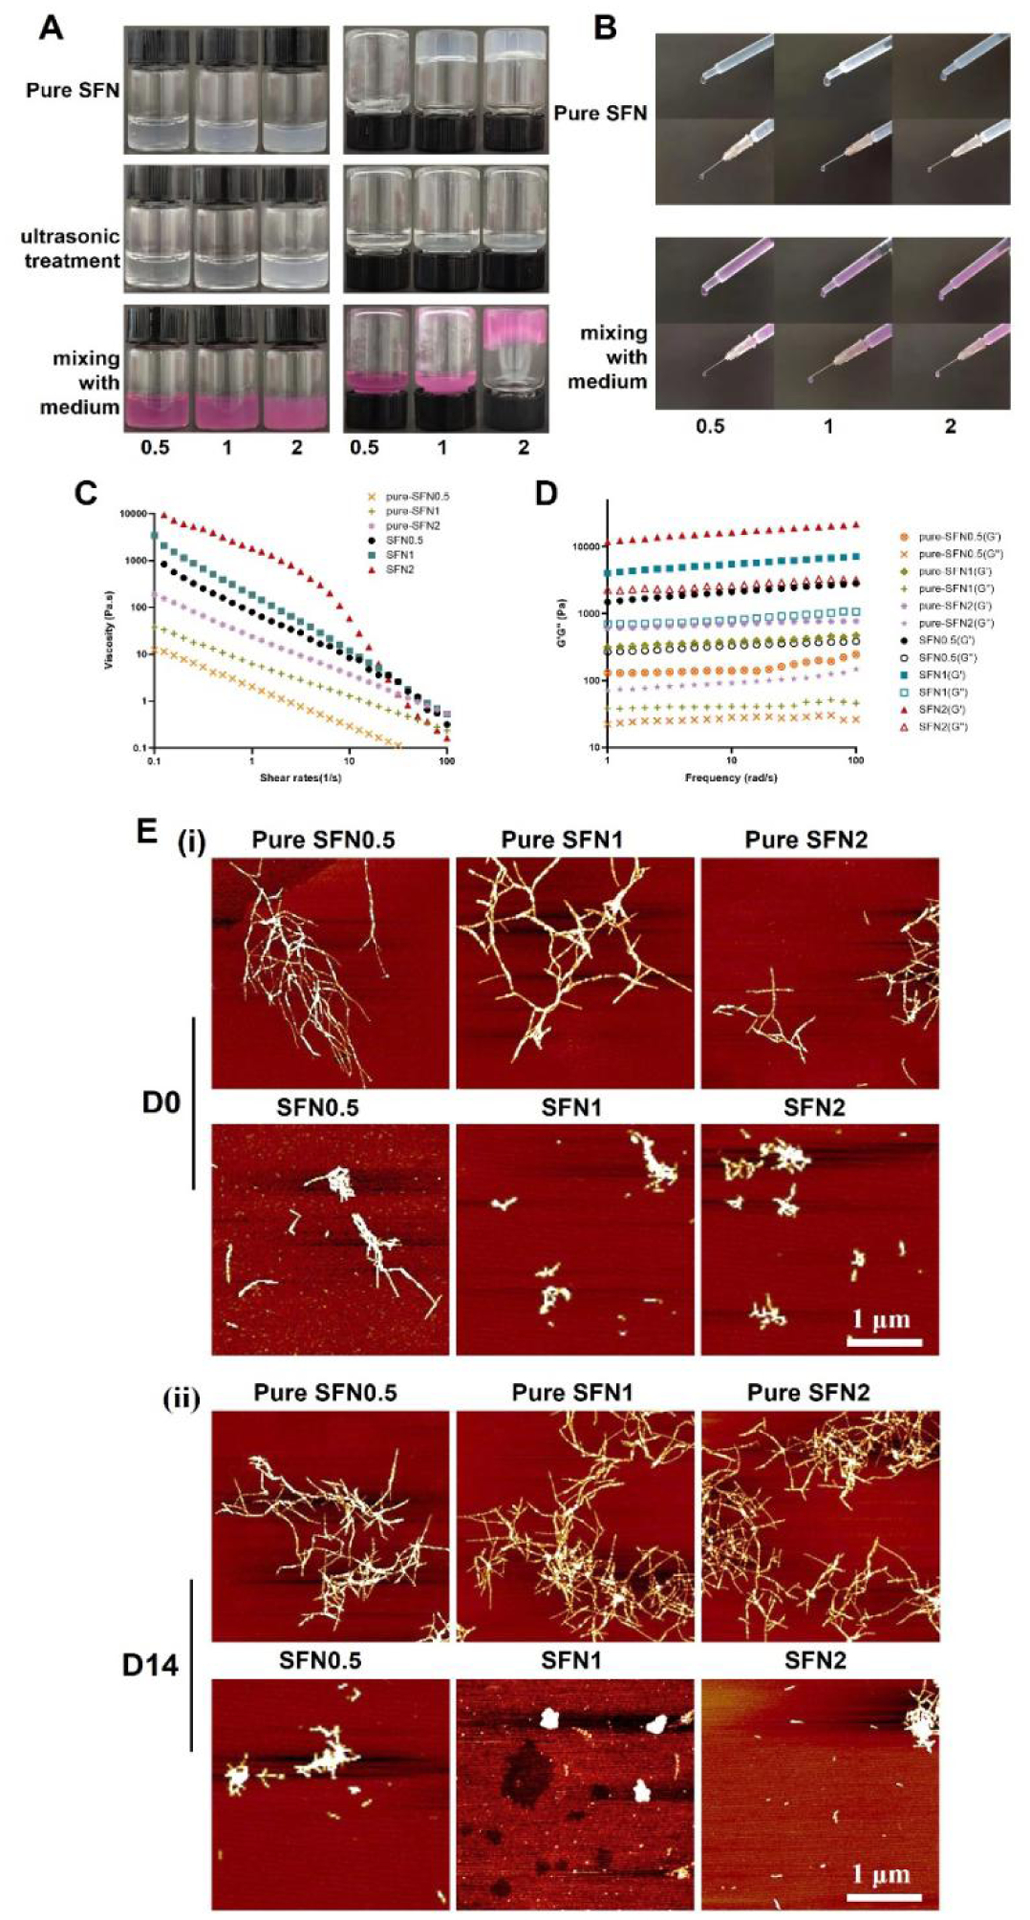
Characterization of the SFN samples before and after the introduction of cell media: (A) Inversion test for 10 min; (B) Injection results. Pure means medium-free SFN samples. 0.5, 1 and 2 indicate SFN concentrations; (C) Viscosity of different samples at 25°C; (D) Storage modulus (G’) and loss modulus (G”) of different samples at 25°C; (E) AFM images of SFN in the samples when placed at 37°C for 0 and 14 days. Scale bars=1 μm.