
Figure 3.
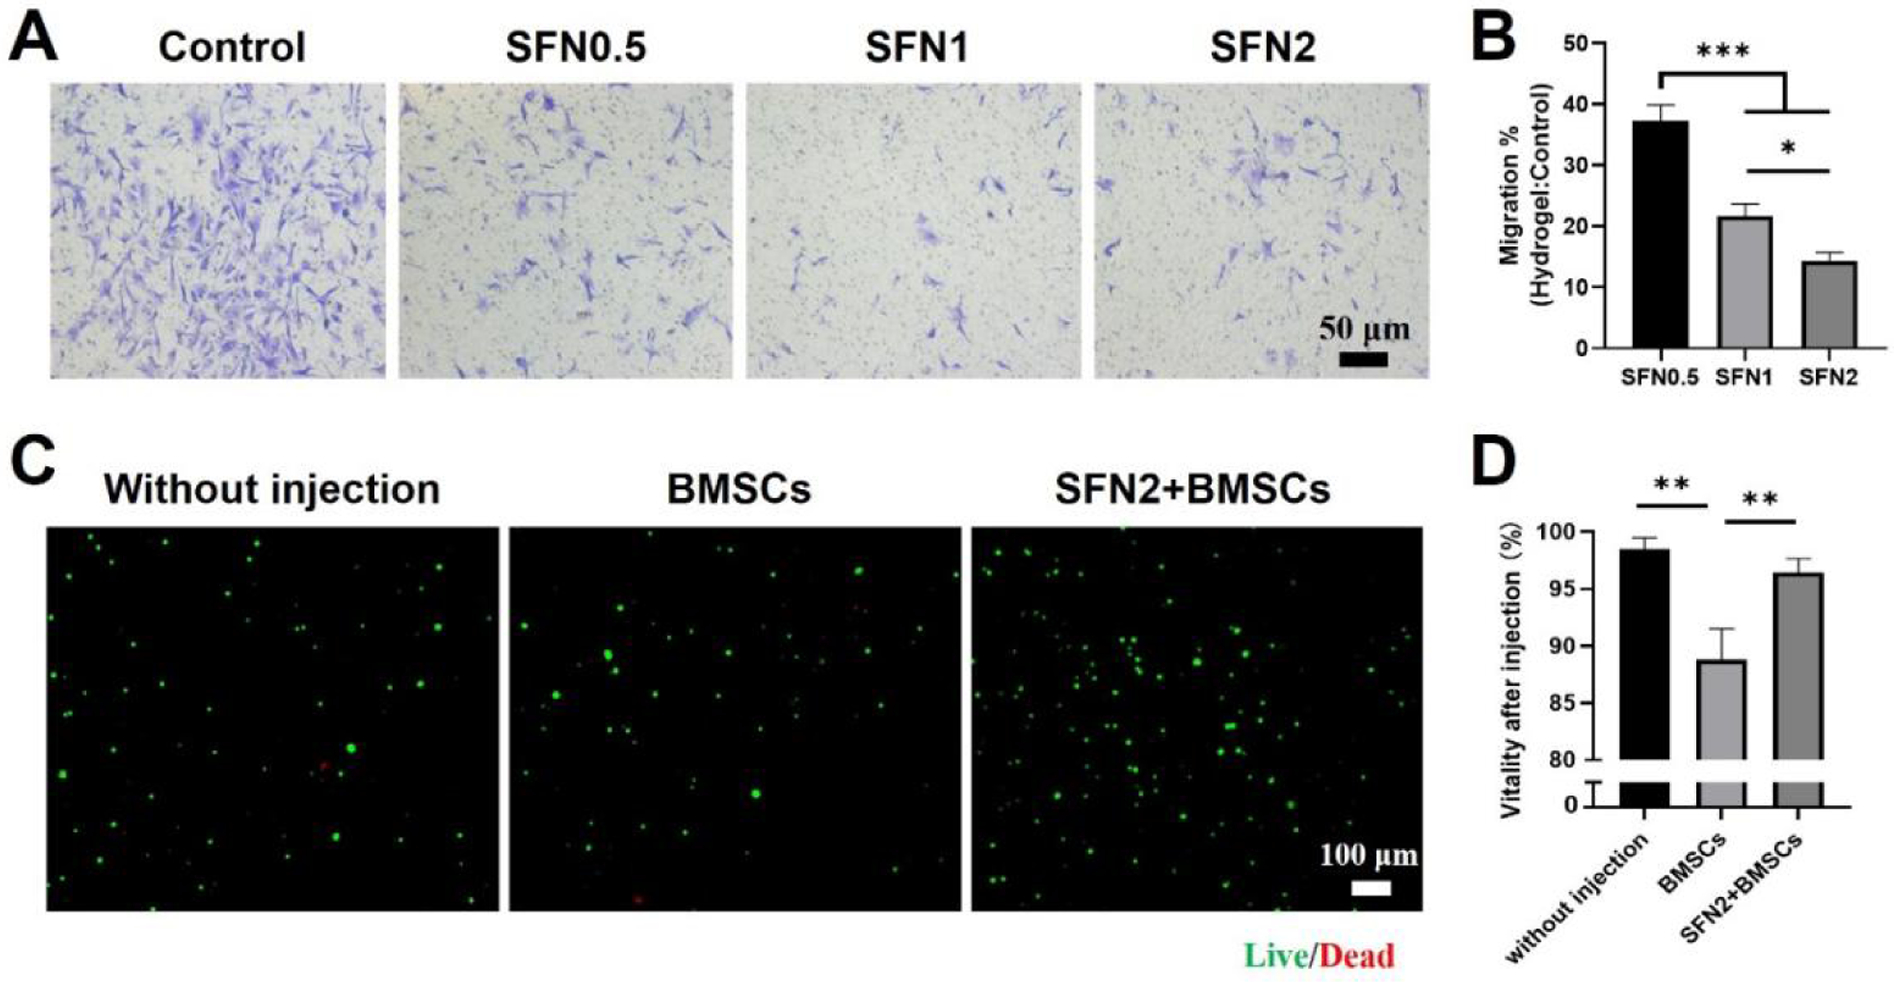
Cell migration in SFN-medium composites and viability after injection: (A) Images of migrated cells after 24 hours, stained (light purple) with crystal violet. (B) Relative migration rates of BMSCs from the SFN-medium composites compared to culture medium control group. (C) CLSM images of BMSCs before and after injection with a 26 G needle. Live (green) cells labeled with Calcein AM and dead (red) cells labeled with ethidium homodimer-1. BMSC group means BMSCs cultured in medium and injected from the needle while SFN2+BMSC group indicates BMSCs loaded in SFN2 and injected from the needle. (D) Cell viability after injection. Data presented as mean ± SD, n=3. Statistically significant *p < 0.05, **p < 0.01, and ***p < 0.001.