
Figure 6.
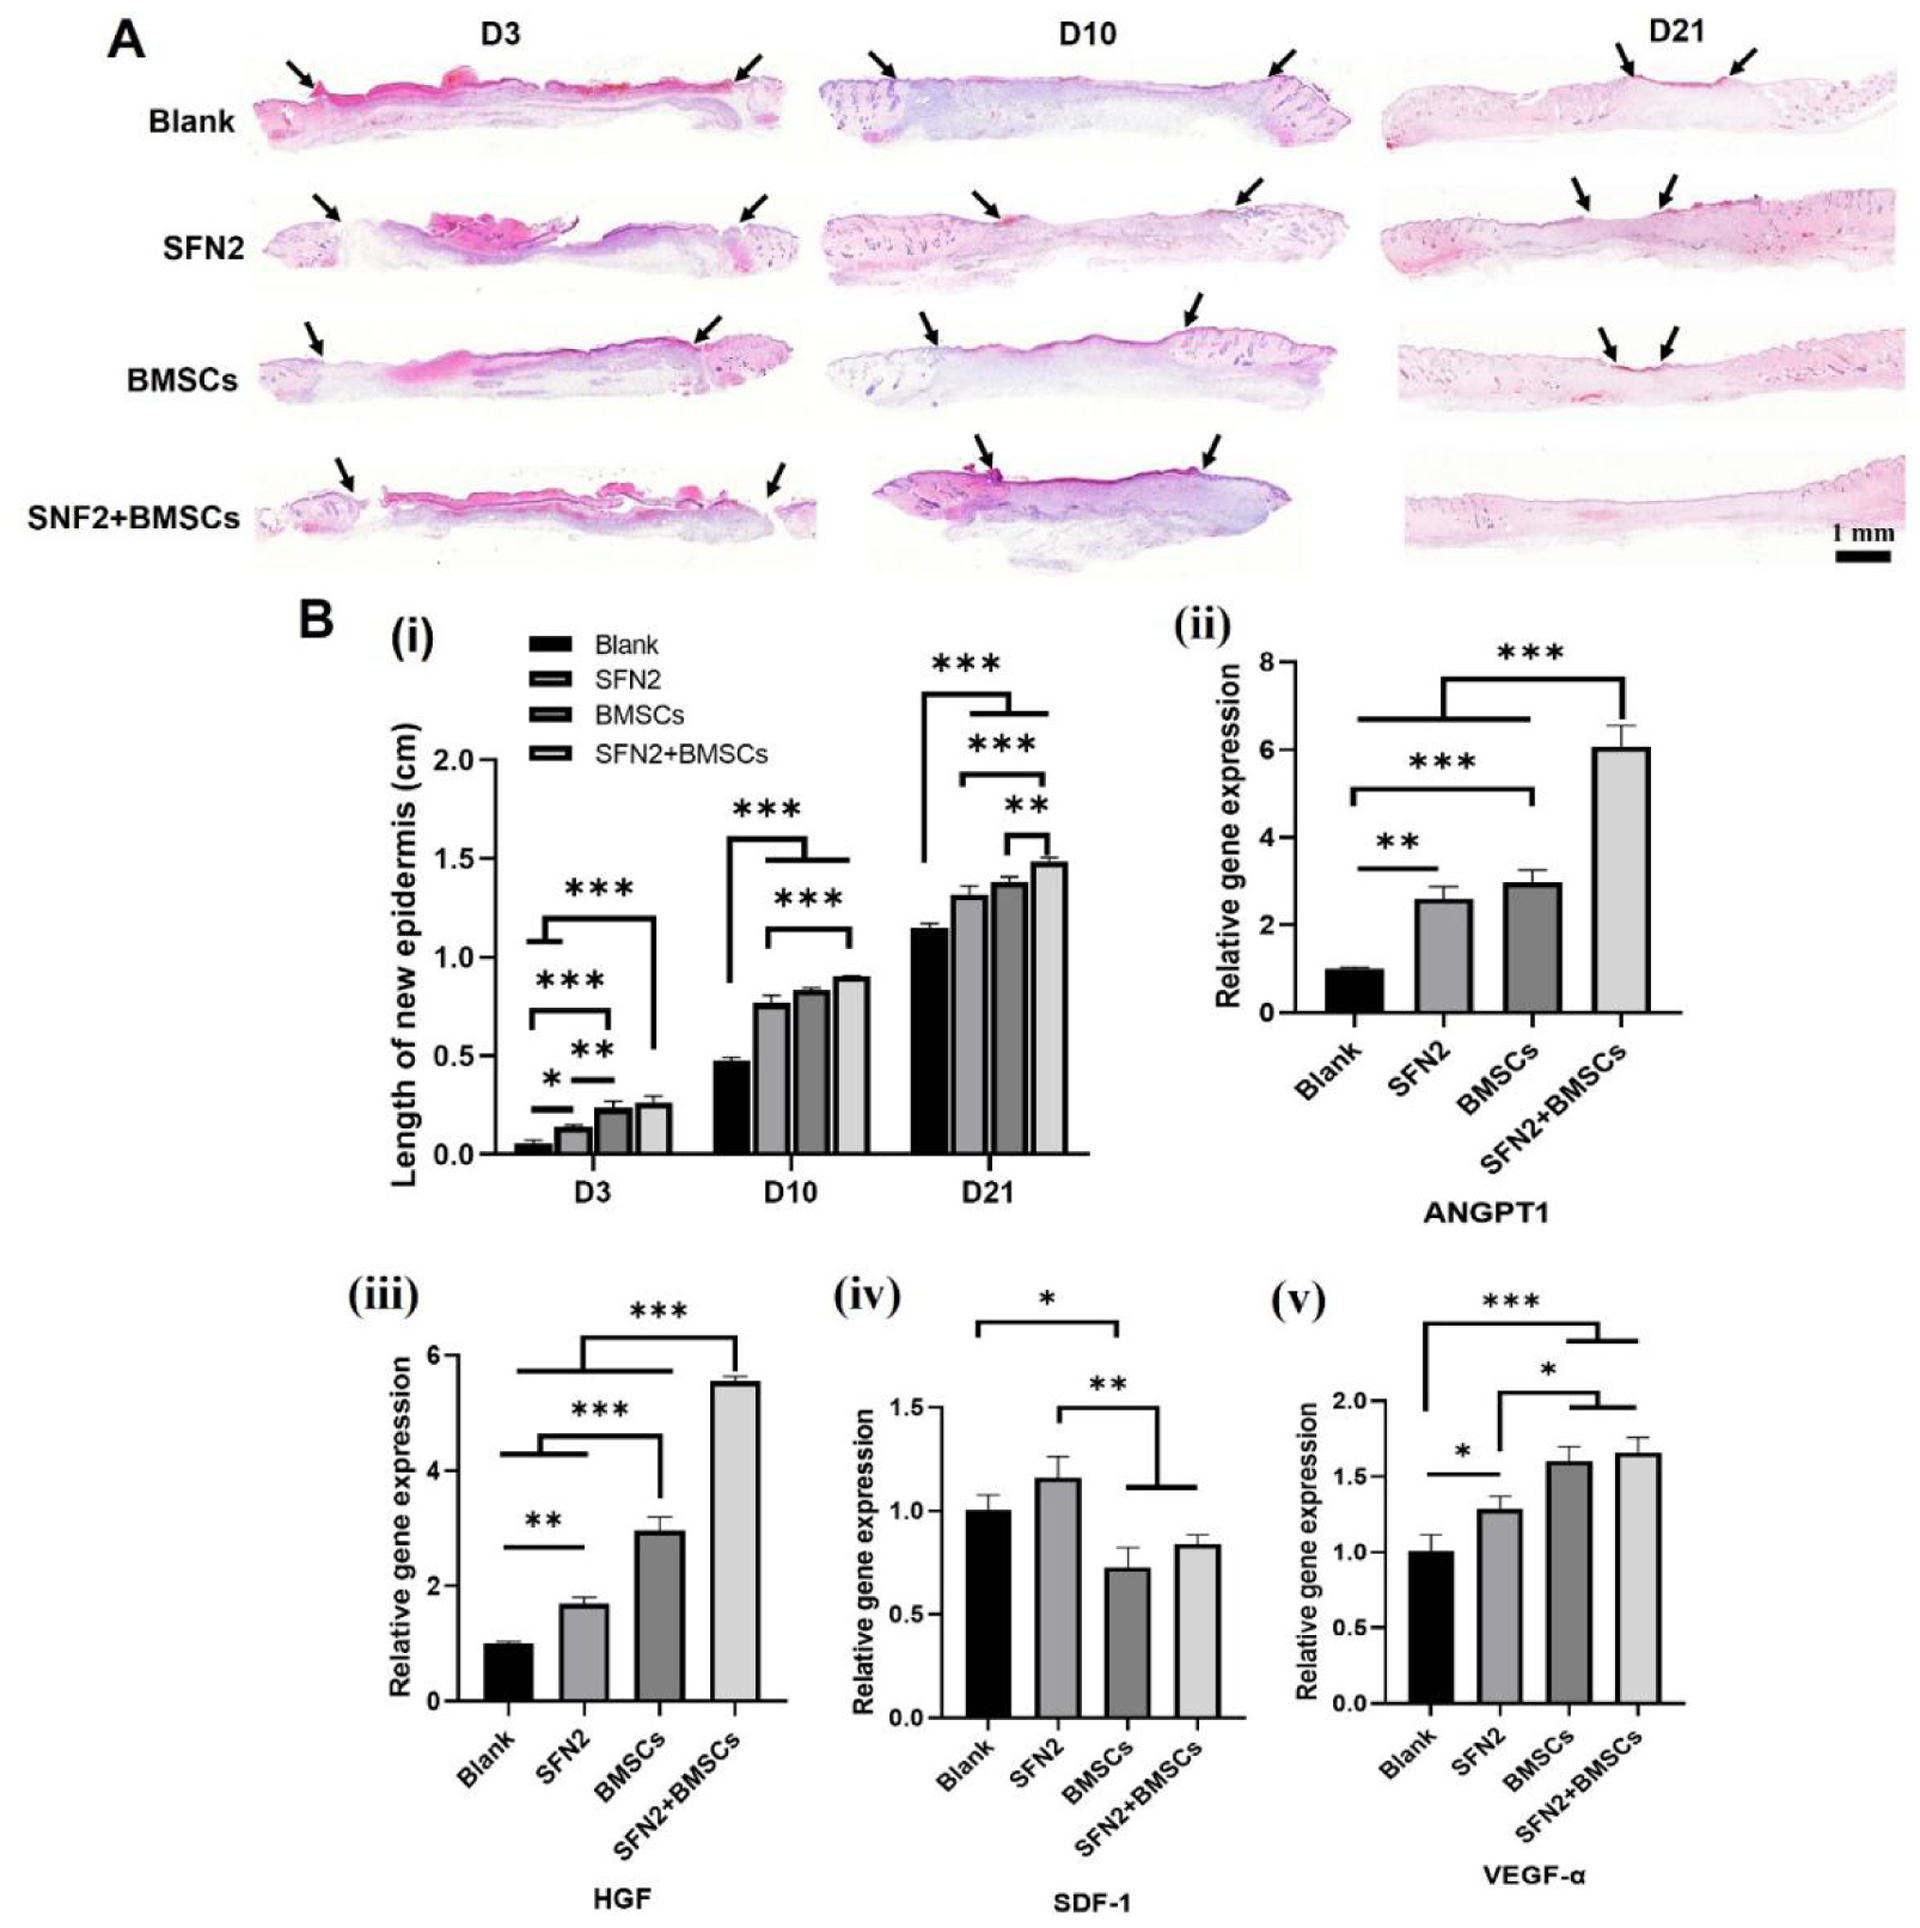
Wound regeneration: (A) Hematoxylin and eosin (H&E) images of wounds treated with the different groups for 3, 10, and 21 days. Scale bars 1 mm. Arrow indicates the epithelial junction; (B,i) The length of new epidermis at days 3, 10 and 21 post-implantation; (B, ⅱ-ⅴ) Wound healing-associated cytokine gene expression at wound sites on day 6 post-implantation. Data presented as mean ± SD, n=3. Statistically significant *p < 0.05, **p < 0.01, and ***p < 0.001.