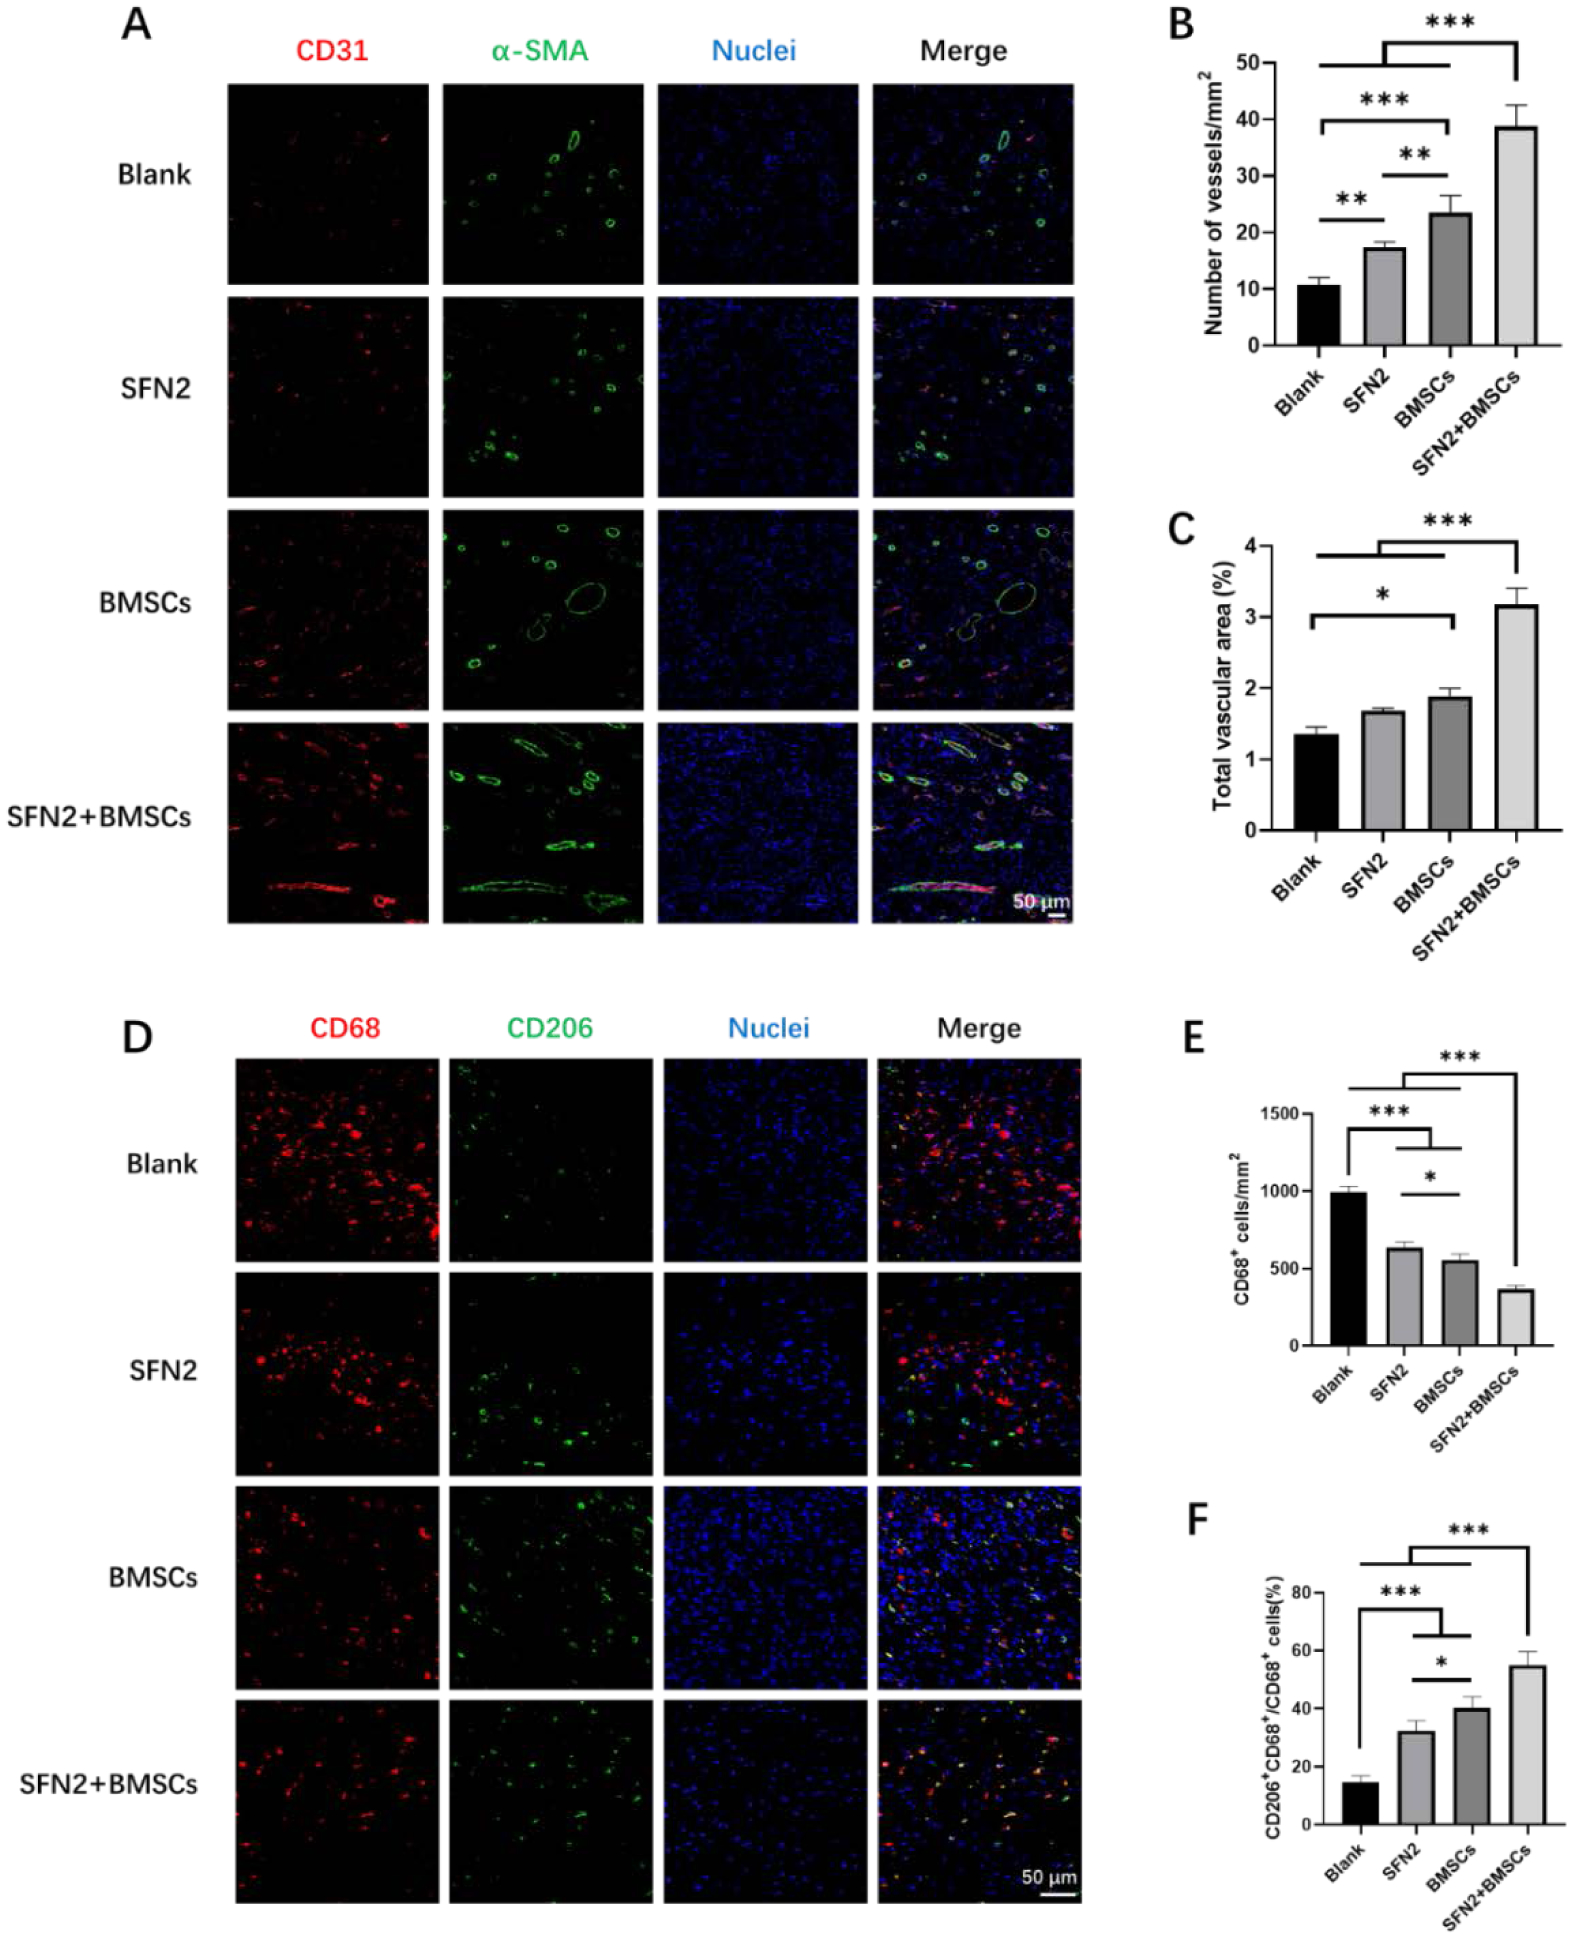
Figure 7.

Angiogenesis and immunoregulation at wound sites in the different groups after 14 days post-surgery. (A) Immunofluorescent images of tissue sections stained with CD31 antibody (red), α-SMA antibody (green) and DAPI (blue). Scale bars 50 μm. (B) Blood vessel numbers per mm2 at wound sites treated with the different groups. (C) Percentage of CD31 vessel volume in fluorescent images. (D) Immunofluorescent images of tissue sections stained with CD68 antibody (red), CD206 antibody (green) and DAPI (blue). Scale bars 50 μm. (E) CD68+ macrophage number per mm2 at wound sites treated with the different groups. (F) Percentage of M2 macrophages over total CD68+ macrophages at wound sites treated with different treatment groups. Data presented as mean ± SD, n=5. Statistically significant *p < 0.05, **p < 0.01, and ***p < 0.001.
