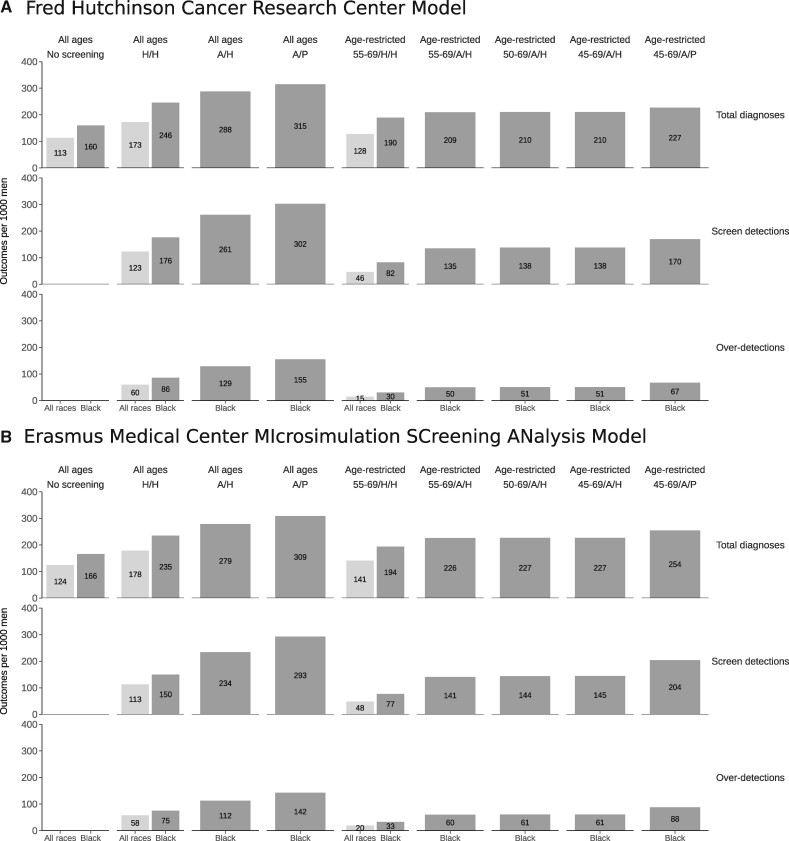
Figure 1.
Total prostate cancer diagnoses, screen detections, and overdiagnosed cases per 1000 men under no screening and historical early detection strategies for all races (light gray) and under no screening, historical, and intensified early detection strategies for Black men (dark gray) projected by (A) the Fred Hutchinson Cancer Research Center model and (B) the Erasmus Medical Center MIcrosimulation SCreening ANalysis model. Results for strategies with and without age restrictions are shown separately. A/H = annual frequency/historical biopsy; A/P = annual frequency/perfect biopsy; H/H = historical frequency/historical biopsy.

