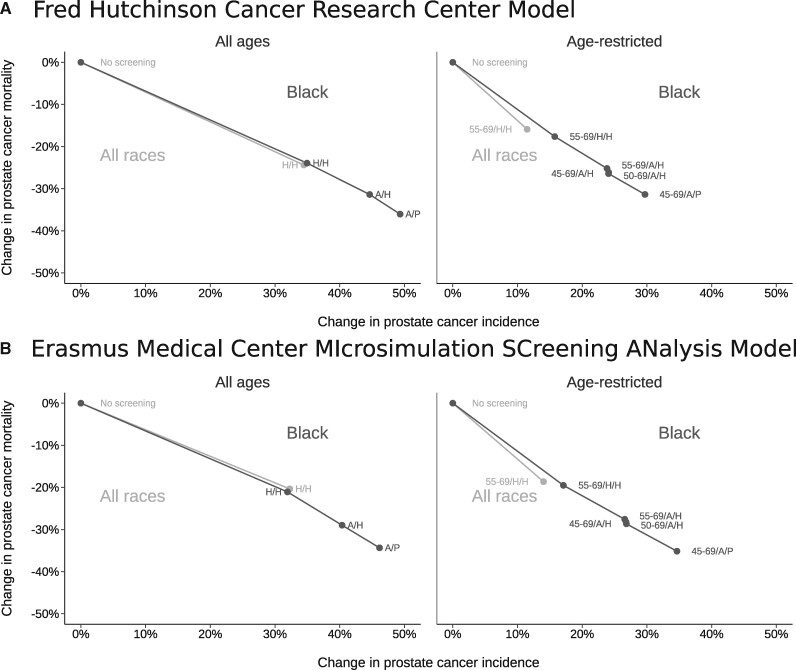
Figure 2.
Changes in prostate cancer incidence (overdiagnosis) and mortality under no screening and historical early detection strategies for all races (light gray) and under no screening, historical, and intensified early detection strategies for Black men (dark gray) projected by (A) the Fred Hutchinson Cancer Research Center model and (B) the Erasmus Medical Center MIcrosimulation SCreening ANalysis model. Lines connect results for each race group. A/H = annual frequency/historical biopsy; A/P = annual frequency/perfect biopsy; H/H = historical frequency/historical biopsy.

