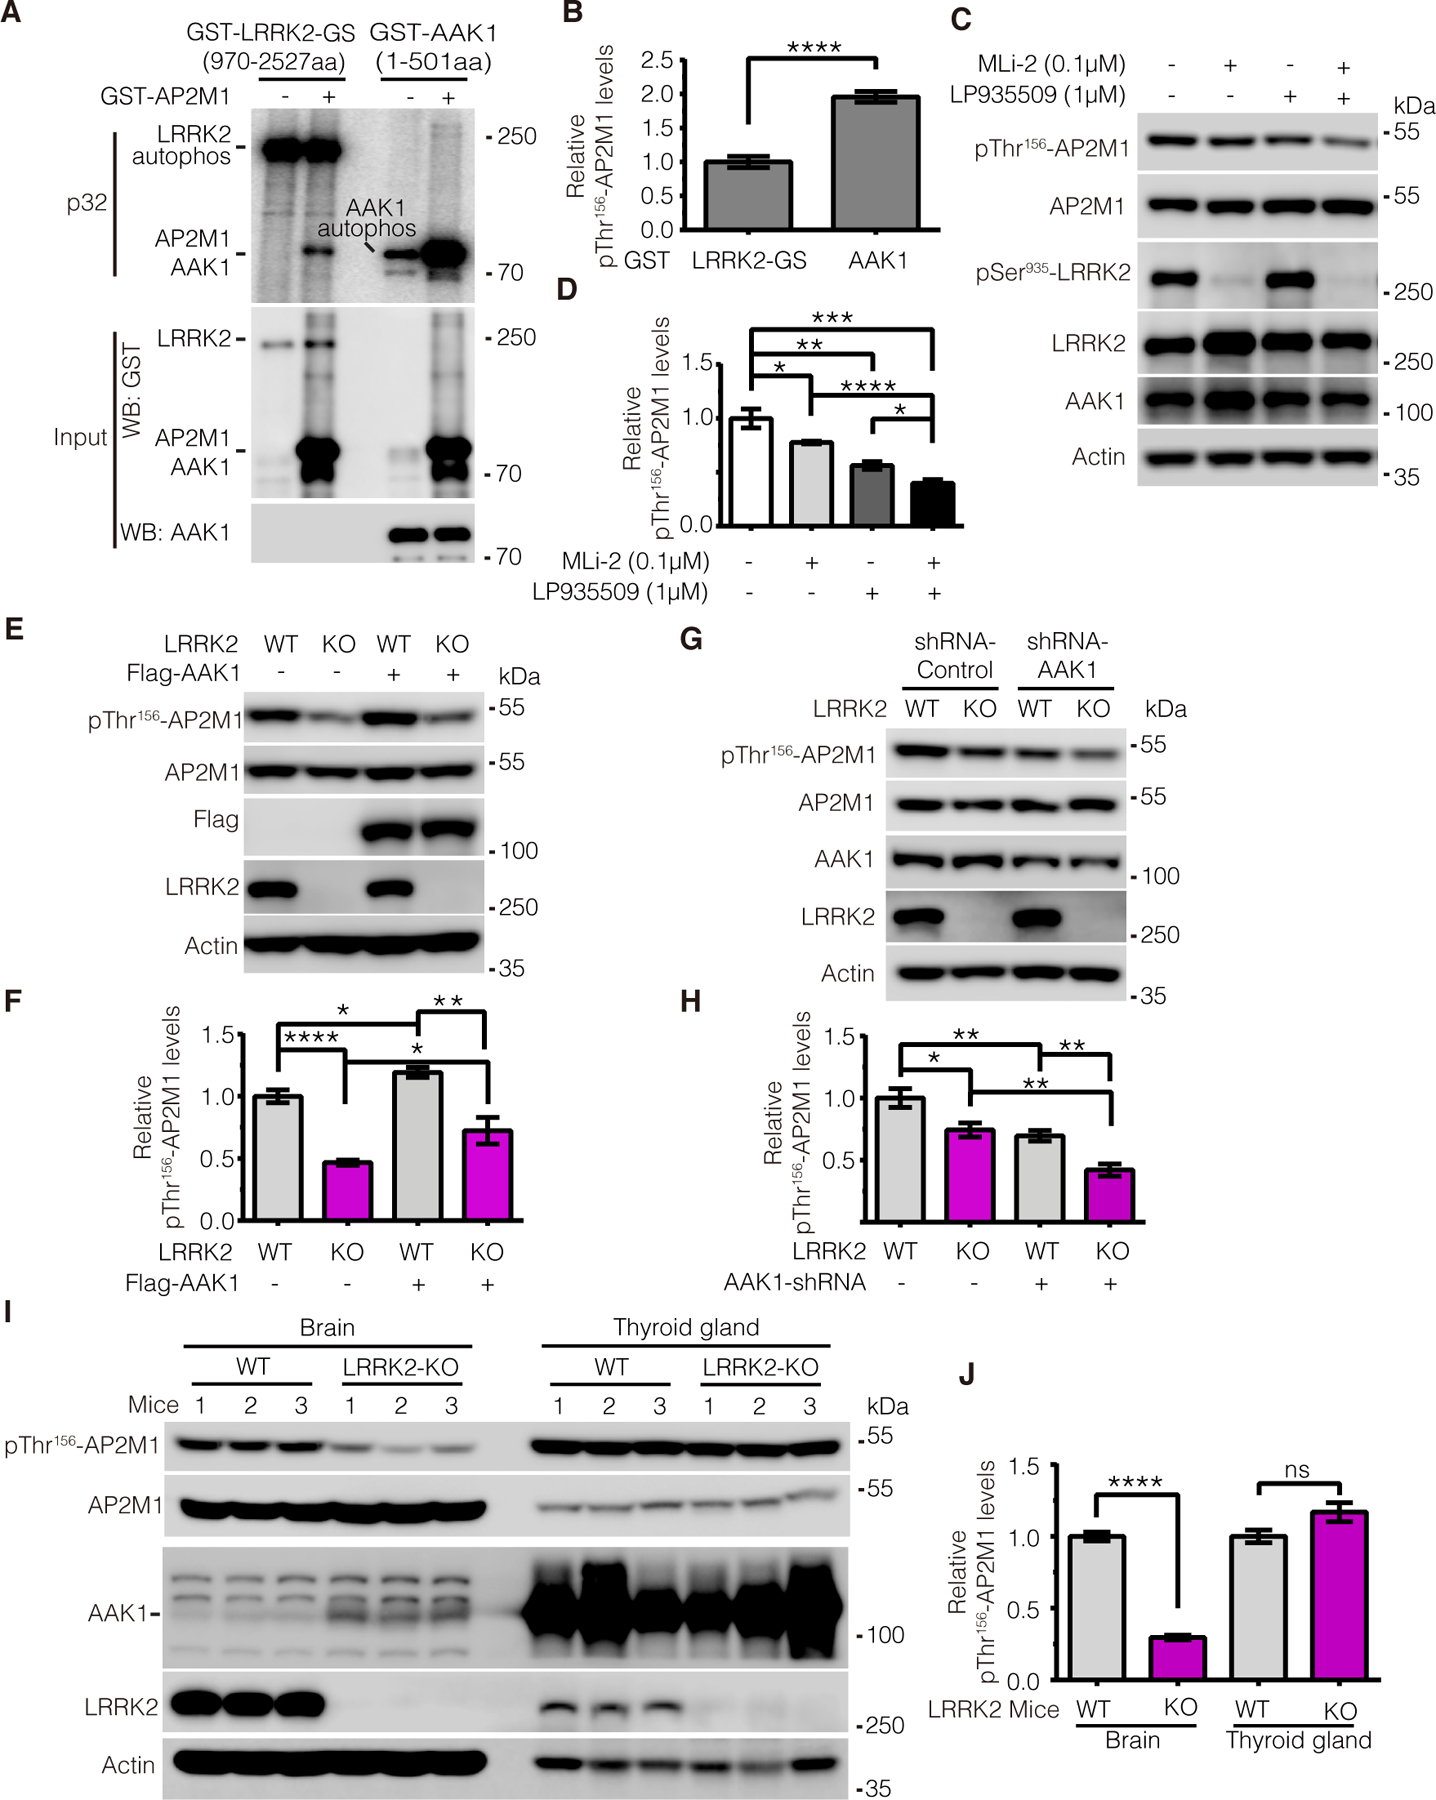
Figure 3. LRRK2 and AAK1 play an independent and tissue-specific role on phosphorylation of AP2M1.

(A and B) In vitro kinase assays assessing the amount of 32P-ATP incorporated by AP2M1 upon equimolar amounts of GST-tagged LRRK2 G2019S (GS) (970–2527aa) and GST-tagged AAK1 (1–501aa). Note that because GST-AAK1 (1–501aa) fragment and GST-AP2M1 have similar molecular weights, the signal in the lane of GST-AAK1 with AP2M1 includes both AAK1 autophosphorylation and AP2M1 phosphorylation by AAK1; thus, to calculate AP2M1 phosphorylation by AAK1, the intensity was subtracted by the AAK1 autophosphorylation signal. (C and D) Immunoblotting analysis of endogenous AP2M1 phosphorylation at Thr156 upon LRRK2 inhibition with MLi-2 and AAK1 inhibition with LP-935509 (0.1 and 1 μM, respectively, for 2 hours). Immunoblotting was performed with antibodies to pThr156-AP2M1 and pSer935-LRRK2. (E and F) Immunoblotting analysis of endogenous AP2M1 Thr156 phosphorylation in LRRK2 WT and KO SH-SY5Y cells with overexpression of AAK1. (G and H) Immunoblotting analysis of endogenous AP2M1 Thr156 phosphorylation in LRRK2 WT or KO SH-SY5Y cells upon transfection of AAK1 shRNA. (I and J) Immunoblotting analysis of endogenous AP2M1 Thr156 phosphorylation in brain tissue and thyroid gland lysates from LRRK2 WT or KO mice. All quantification data in (A to J) are mean ± SEM from n=5 independent experiments; each experiment in (I and J) consisted of 3 WT and 3 KO mice. Blots were quantified by ImageJ software. *P < 0.05, **P < 0.01, ***P < 0.001, and ****P < 0.0001 by Student’s t tests for two comparisons or one-way ANOVA followed by a Tukey’s post hoc test for multiple comparisons.
