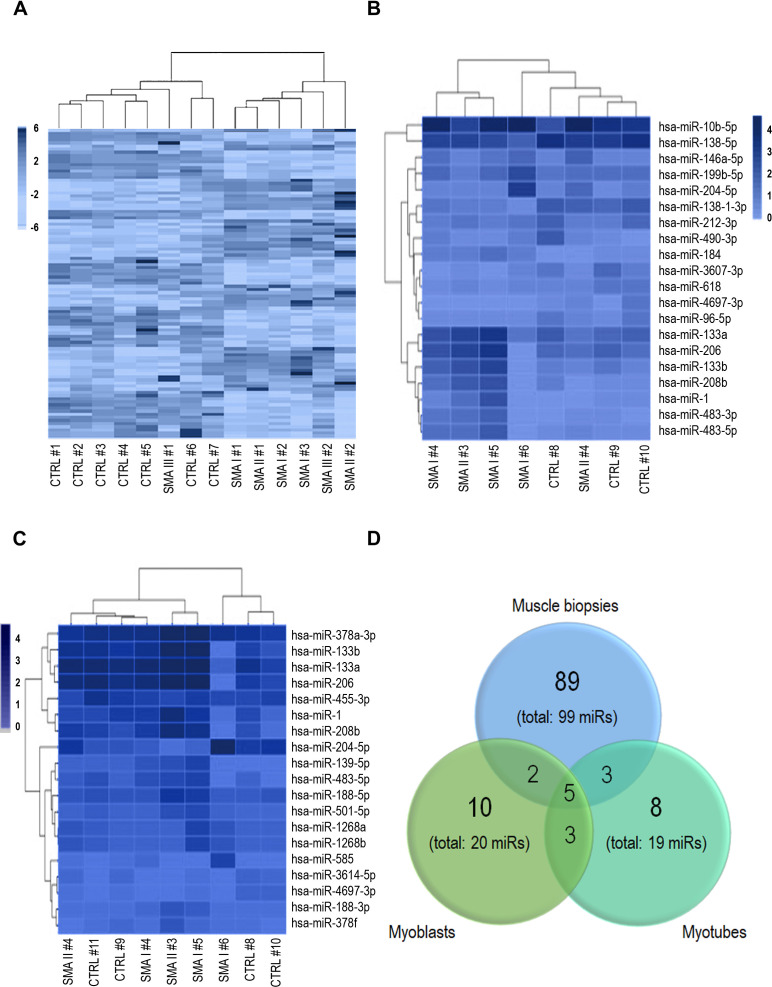
Figure 1. Heatmaps obtained by the whole miRNome analysis of muscle biopsies (A), myoblasts (B), and myotubes (C) of spinal muscular atrophy (SMA) patients and controls; patient and control samples display a separate clusterization.
99, 20, and 19 miRs were found deregulated in SMA in muscle biopsies, myoblasts, and myotubes, respectively; (D) Venn’s diagram showing the five miRNAs shared among the three groups, three between myoblasts and myotubes, two between myoblasts and biopsies, and three between myotubes and biopsies.

