. 2021 Sep 20;10:e68054. doi: 10.7554/eLife.68054

Figure 5. The spinal muscular atrophy score (SMA-score) predicts the phenotypic severity in SMA patients.

Correlation between the SMA-score and the clinical decimal SMA subtype in the whole cohort (A) and aged <6 years (B). Red circles are individual samples, the blue line indicates the expected distribution, the green line indicates the 95% confidence interval, and the black lines are the prediction interval.

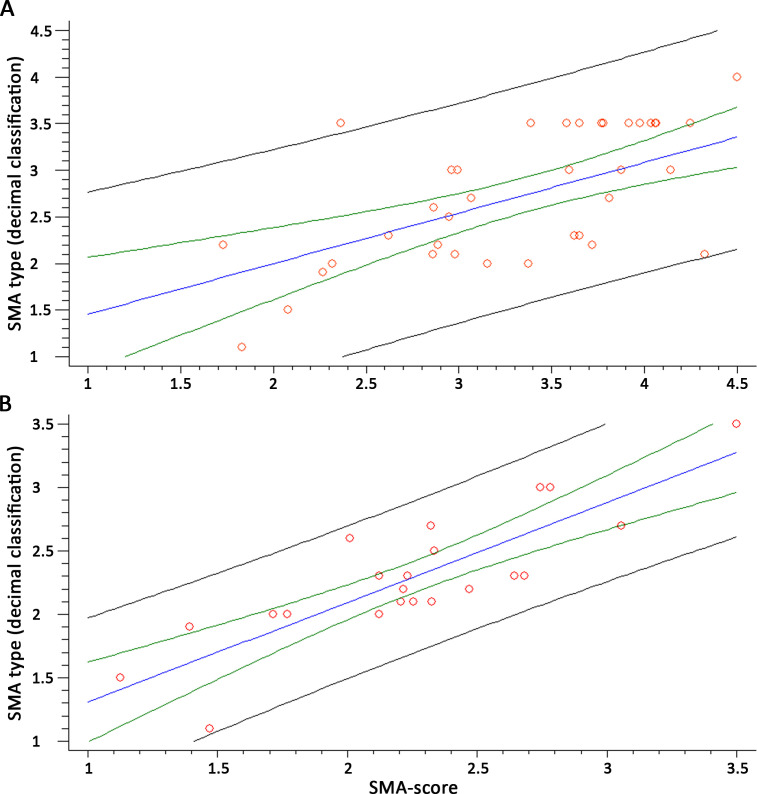
Figure 5.

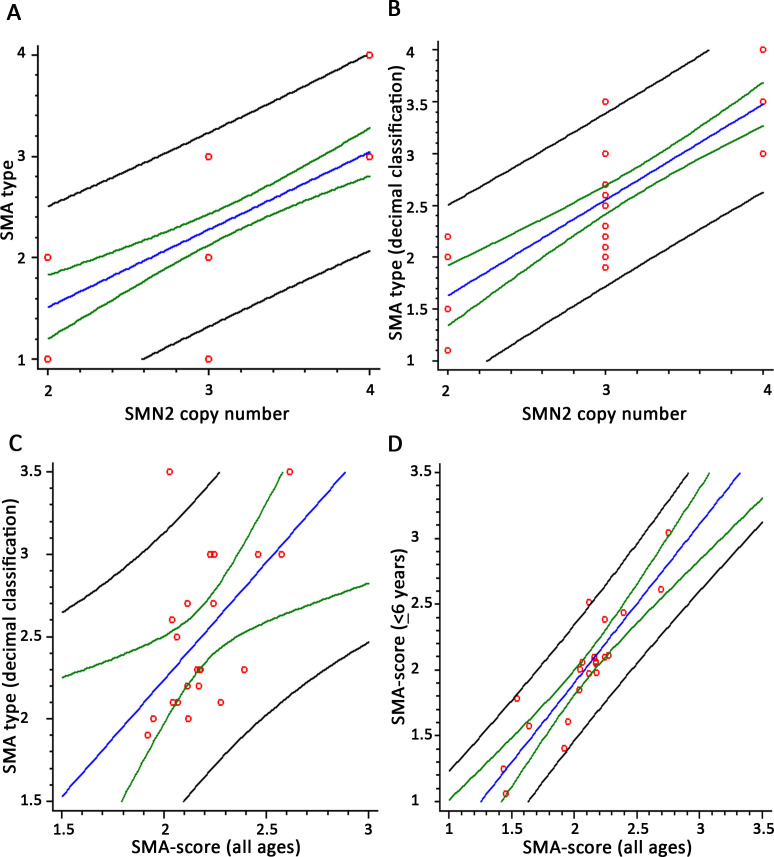
Figure 5—figure supplement 1. Linear correlation analysis among SMN2 copy number and spinal muscular atrophy (SMA) type, estimated by the standard classification (A; R2 = 52.45%, n = 41, p<10–5) and the decimal classification (B; R2 = 67.04%, n = 39, p<10-5).

Figure 5—figure supplement 1.

Correlation with SMA-score and SMA type estimated by the decimal classification in patients with three SMN2 copies (C; R2 = 30.04, n = 21, p=0.008). Linear correlation analysis among SMA-scores obtained with the two equations (all ages vs. <6 years) (D; R2 = 80.31, n = 21, p<10-5). Red circles are individual samples, the blue line indicates the expected distribution, the green line indicate the 95% confidence interval, and the black lines are the prediction interval.