. 2021 Aug 19;10:e67509. doi: 10.7554/eLife.67509

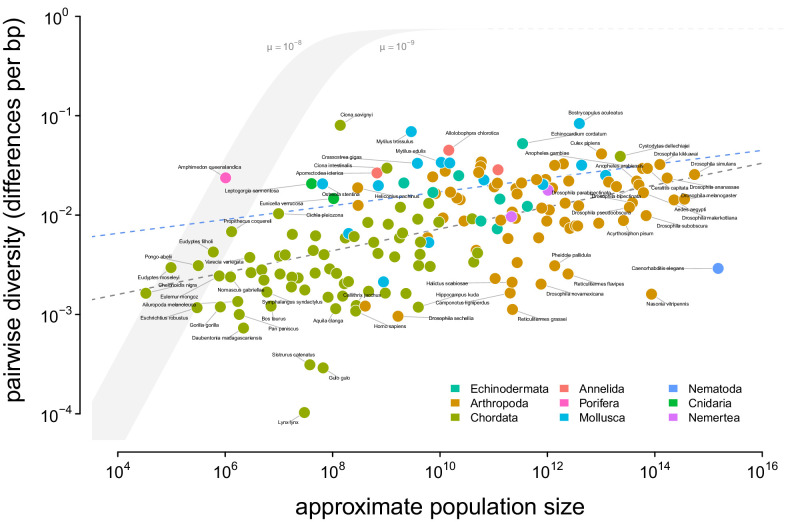
Figure 2. A visualization of Lewontin’s Paradox of Variation.

Pairwise diversity (data from Leffler et al., 2012, Corbett-Detig et al., 2015, and Romiguier et al., 2014), which varies over three orders of magnitude, shows a weak relationship with approximate population size, which varies over 12 orders of magnitude. The shaded curve shows the range of expected neutral diversity if Ne were to equal Nc under the four-alleles model, log10(π)=log10(θ)log10(1+4θ/3) where θ=4Ncμ, for two mutation rates, μ=10-8 and μ=10-9, and the light gray dashed line represents the maximum pairwise diversity under the four alleles model. The dark gray dashed line is the OLS regression fit, and the blue dashed line is the regression fit using a phylogenetic mixed-effects model. Points are colored by phylum. The species Equus ferus przewalskii (Nc103 and π=3.6×10⁻³) was an outlier and excluded from this figure for visual clarity.

Figure 2—source data 1. The diversity and population size dataset for 172 metazoan taxa.

Figure 2.

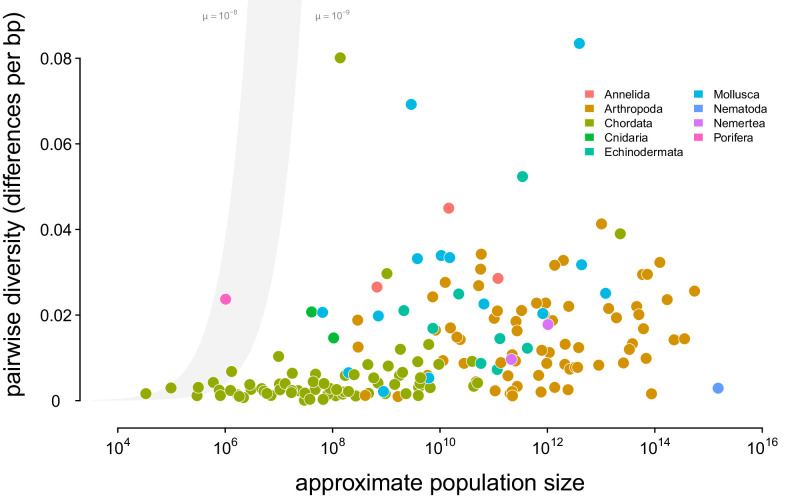
Figure 2—figure supplement 1. A linear-log version of Figure 2.

Figure 2—figure supplement 1.

Points are colored by phylum, and the shaded region is the predicted neutral level of diversity assuming Ne=Nc with mutation range ranging between 109μ108.
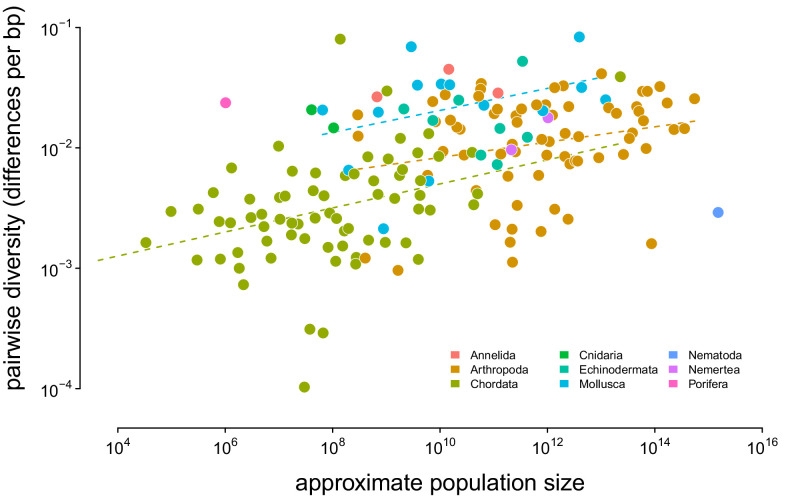
Figure 2—figure supplement 2. A version of Figure 2 with OLS estimates per phylum.

Figure 2—figure supplement 2.

Diversity and approximate population size for 172 taxa, colored by phylum; the dashed lines indicate the non-phylogenetic OLS estimates of the relationship between population size and diversity grouped by phyla.
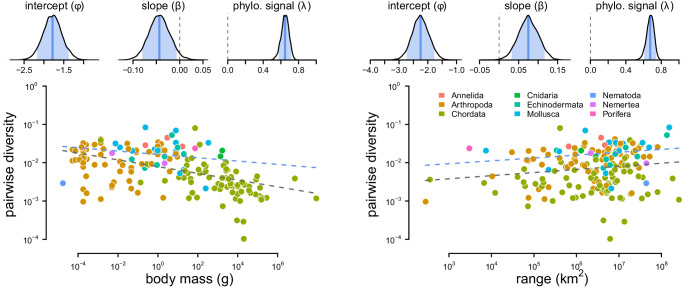
Figure 2—figure supplement 3. The posterior distributions and fitted relationship between diversity and both body mass and range size.

Figure 2—figure supplement 3.

The relationship between diversity (differences per basepair) and body mass (left) and range (right) across 172 species. The top row are posterior distributions of parameters estimated using the phylogenetic mixed-effects model using 166 taxa in the synthetic phylogeny for the intercept, slope, and phylogenetic signal from the mixed-effects model. The bottom row contain each species as a point, colored by phyla. The gray dashed line is the non-phylogenetic standard regression estimate, and the blue dashed line is the relationship fit by the phylogenetic mixed-effects model.
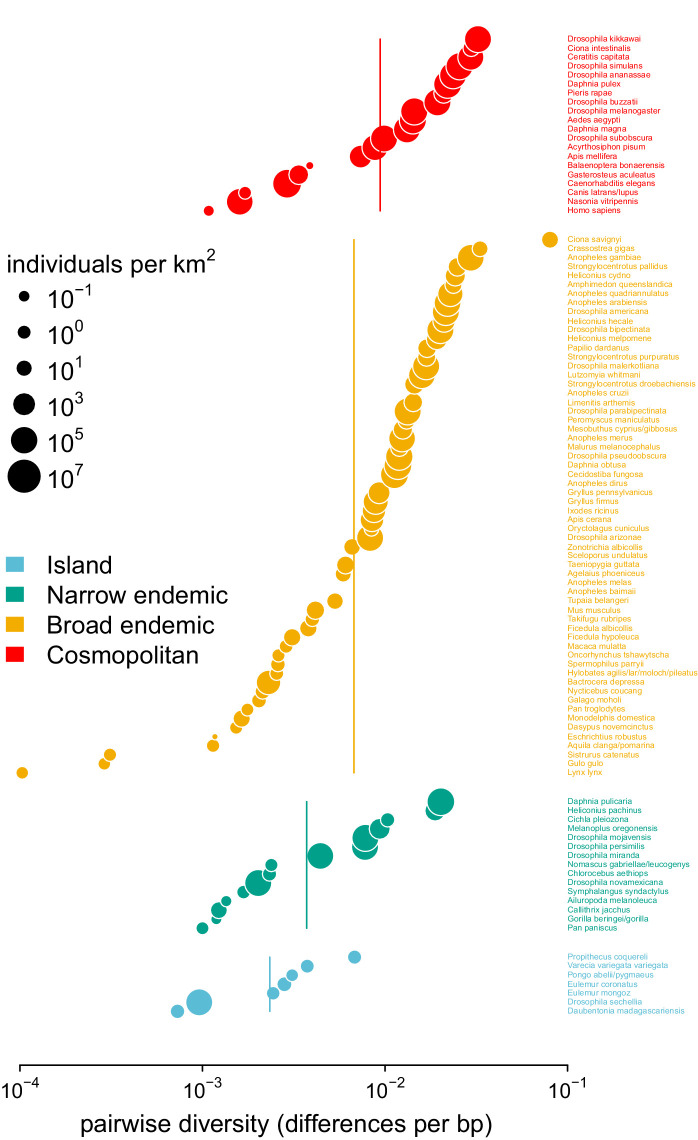
Figure 2—figure supplement 4. Pairwise diversity grouped by the range categories from Leffler et al., 2012, with point size indicating the predicted population density.

Figure 2—figure supplement 4.

The vertical lines are the range category group means.