. 2021 Sep 1;10:e71642. doi: 10.7554/eLife.71642

Figure 2. Akita, but not hCOL1A1, accumulates in the endoplasmic reticulum (ER) as large puncta in SEC24C-depleted cells.

A) U2OS cells expressing Akita-sfGFP and LAMP1-mCherry were depleted of SEC24C or SEC24A by siRNA, and treated with bafilomycin A1 (Baf) before imaging. Arrowheads in the inset indicate Akita in the LAMP1 structures. (B) Quantitation of Akita-sfGFP in LAMP1-mCherry structures for the data shown in (A). The DMSO control for each condition was set to 1.0. The relative pixel intensity for each condition is the mean intensity of Akita-sfGFP in the pixels that overlap with LAMP1. In the top-right corner, the specificity of the SEC24C knockdown is shown. Cells were depleted of the different SEC24 isoforms by siRNA and immunoblotted for SEC24C. (C) Cells were depleted of the different SEC24 isoforms and analyzed for the accumulation of large Akita puncta (≥0.5 µm2). Arrows point to large Akita puncta. (D) Bar graph showing the % of cells with large Akita puncta for the data shown in (C). Large Akita puncta only accumulated in siSEC24C cells; however, the % siSEC24C cells with puncta of all sizes (51.7 ± 3.3%) appeared to be roughly the same as the siCtrl (55.3 ± 1.1%). (E) Cells expressing EGFP-hCOL1A1 were treated for 3.5 hr with MRT68921 or depleted of FAM134B, RTN3, or SEC24C by siRNA and analyzed for the accumulation of EGFP-hCOL1A1 puncta. (F) Bar graph showing EGFP-hCOL1A1 puncta per cell for the data shown in (E). Puncta of all sizes were quantitated. Scale bars in (A), (C), and (E), 10 µm. Error bars in (B), (D), and (F) represent SEM; n = 3–4 independent experiments, n = 20–40 cells/experiment. NS: not significant (p≥0.05); *p<0.05, **p<0.01; ***p<0.001, Student’s unpaired t-test.

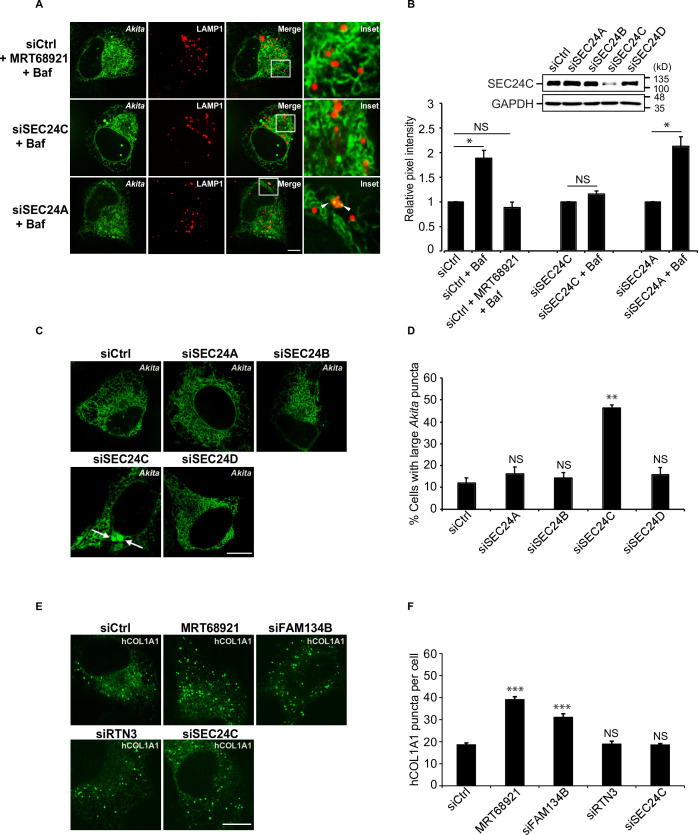
Figure 2—source data 1. Uncropped blots for Figure 2B.

Figure 2.

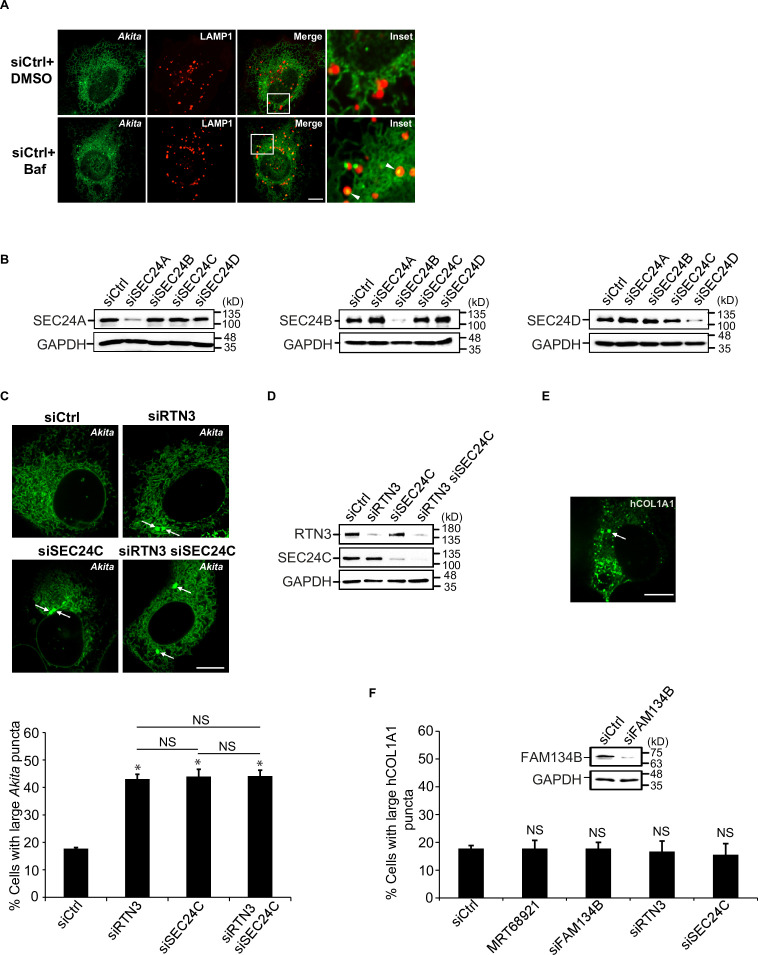
Figure 2—figure supplement 1. The delivery of Akita to lysosomes requires SEC24C.

Figure 2—figure supplement 1.

(A) Cells expressing Akita-sfGFP and LAMP1-mCherry were treated with DMSO or Baf and examined by confocal microscopy. Arrowheads in the inset indicate Akita in the LAMP1 structures. Quantitation is shown in Figure 2B. (B) Cells were depleted of the different SEC24 isoforms by siRNA, and the specificity of the knockdowns was analyzed by immunoblotting. (C) RTN3 and SEC24C act on the same pathway. Cells expressing Akita-sfGFP were depleted of either RTN3, SEC24C, or RTN3 and SEC24C by siRNA and analyzed for the accumulation of large Akita puncta by confocal microscopy (top). Arrows point to large Akita puncta. Bar graph (bottom) showing the % of cells with large Akita-sfGFP puncta (≥0.5 µm2) for the data shown above. (D) Immunoblot to confirm the knockdown of RTN3 and SEC24C in siRNA-treated cells. (E) A representative control cell showing a large EGFP-hCOL1A1 punctum. The arrow points to a punctum that is ≥0.5 µm2 in size. (F) Large EGFP-hCOL1A1 puncta did not accumulate in MRT68921 treated cells or cells depleted of FAM134B, RTN3, or SEC24C by siRNA. Bar graph shows the % of cells with large EGFP-hCOL1A1 puncta (≥0.5 µm2) in the indicated samples (bottom). An immunoblot to confirm the knockdown of FAM134B is shown (top). Scale bars in (A), (C), and (E), 10 µm. Error bars in (C, F) represent SEM; n = 3 independent experiments. Approximately 20–30 cells were analyzed in each experiment. NS: not significant (p≥0.05); *p<0.05, Student’s unpaired t-test.
Figure 2—figure supplement 1—source data 1. Uncropped blots for Figure 2—figure supplement 1B.
Figure 2—figure supplement 1—source data 2. Uncropped blots for Figure 2—figure supplement 1D.
Figure 2—figure supplement 1—source data 3. Uncropped blots for Figure 2—figure supplement 1F.