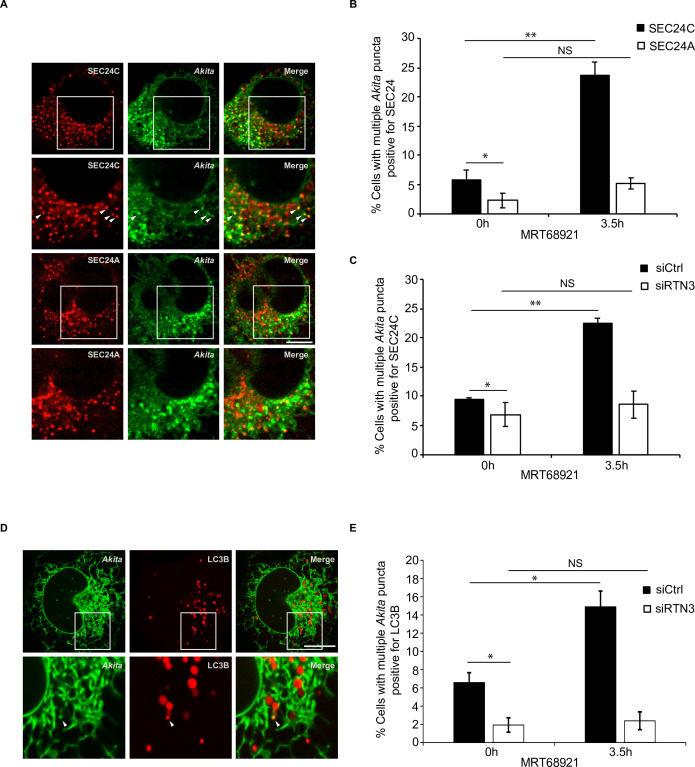
Figure 4. Disrupting autophagy leads to the accumulation of Akita puncta that colocalize with SEC24C, and LC3B, but not SEC24A.
(A) U2OS cells expressing Akita-sfGFP and mCherry-SEC24C or mCherry-SEC24A were treated with MRT68921 for 3.5 hr. Arrowheads in the inset indicate Akita puncta colocalizing with SEC24C. (B) Bar graph showing the % of cells with multiple Akita-sfGFP puncta colocalizing with mCherry-SEC24C or mCherry-SEC24A puncta 0 or 3.5 hr after treatment with MRT68921. (C) Cells expressing Akita-sfGFP and mCherry-SEC24C were depleted of RTN3 by RNAi and treated with MRT68921 for 0 or 3.5 hr. The % of cells showing multiple Akita-sfGFP puncta colocalizing with mCherry-SEC24C puncta was quantified at the indicated time points. (D) Cells expressing Akita-sfGFP and mCherry-LC3B were depleted of RTN3 and treated with MRT68921 for 0 or 3.5 hr. A representative image for control cells (3.5 hr) is shown. Arrowhead in the inset shows an Akita puncta colocalizing with LC3B. (E) Bar graph showing the % of cells with multiple Akita-sfGFP puncta colocalizing with mCherry-LC3B puncta for the data shown in (D). Scale bars in (A) and (D), 10 µm. Error bars in (B), (C), and (E) represent SEM; n = 3 independent experiments. Approximately 20–30 cells/experiment were examined. NS: not significant (p≥0.05); *p<0.05, **p<0.01, Student’s unpaired t-test.


