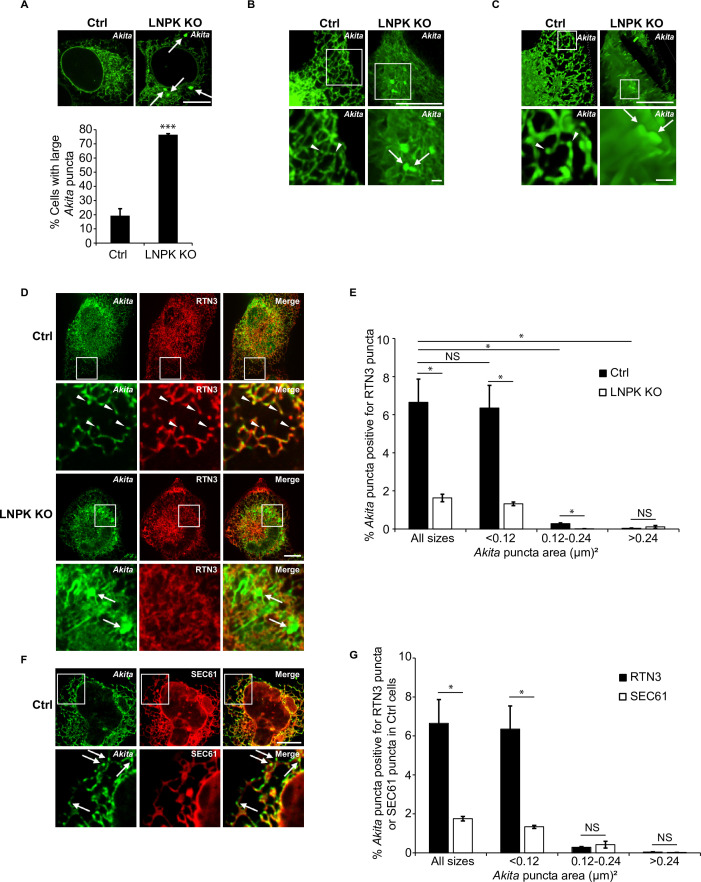
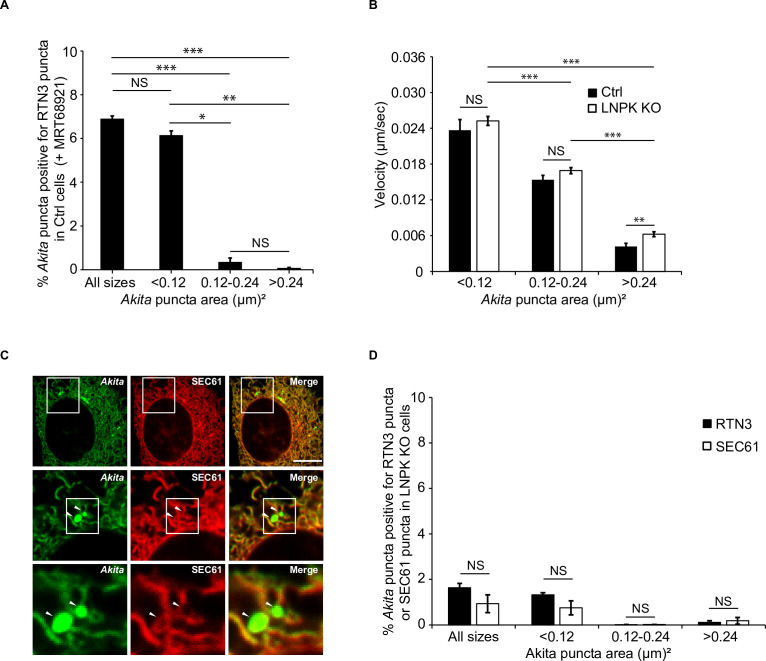
Figure 5. Large Akita puncta accumulate in LNPK KO cells.
(A) Control (Ctrl) and LNPK KO cells were analyzed for the accumulation of large Akita puncta (≥0.5 µm2) by confocal microscopy (top). Arrows point to large puncta. Bar graph shows the % of cells with large Akita-sfGFP puncta (bottom). (B) Maximum intensity projections showing Akita puncta in Ctrl and LNPK KO cells used for the 3D reconstructions shown in Videos 3 and 4. (C) Frames from representative 3D reconstructions of Z stacks of a Ctrl cell (left, 27.5 s in Video 3) and an LNPK KO cell (right, 39 s in Video 4) are shown. Arrowheads mark small Akita puncta, while arrows mark the large puncta. Scale bar for top images in (B) and (C), 10 µm. The insets that are enlarged at the bottom, 1 µm. (D) Ctrl or LNPK KO cells stably expressing mCherry-RTN3 were examined for colocalizing Akita-sfGFP puncta. Arrowheads in the inset indicate Akita puncta colocalizing with RTN3 puncta (top). Arrows show large Akita puncta (≥0.5 µm2) in LNPK KO cells that do not colocalize with RTN3 (bottom). (E) Bar graph for the data shown in (D) of % Akita-sfGFP puncta of different sizes that colocalize with mCherry-RTN3 puncta. (F) Control cells expressing Akita-sfGFP and mCherry-SEC61β were analyzed by confocal microscopy. Arrows mark Akita puncta. (G) Bar graph for the Ctrl data shown in (D) and (F) of % Akita-sfGFP puncta of different sizes that colocalize with either mCherry-RTN3 puncta or mCherry-SEC61β puncta. To identify Akita, RTN3, or SEC61 puncta, the Yen threshold algorithm, which identifies punctate accentuations on the network, was used. We then identified colocalized puncta (Akita-RTN3, Akita-SEC61) using the Boolean image calculator in ImageJ. Colocalizing puncta were calculated as follows: Akita puncta colocalized with RTN3 puncta/total Akita puncta × 100% or Akita puncta colocalized with SEC61 puncta/total Akita puncta × 100%. Scale bars in (A), (D), and (F), 10 µm. Error bars in (A), (E), and (G) represent SEM; n = 3 independent experiments. Approximately 30–40 cells were examined/experiment for (A), and 15–30 cells/experiment for (E) and (G). NS: not significant (p≥0.05); *p<0.05, ***p<0.001, Student’s unpaired t-test.

