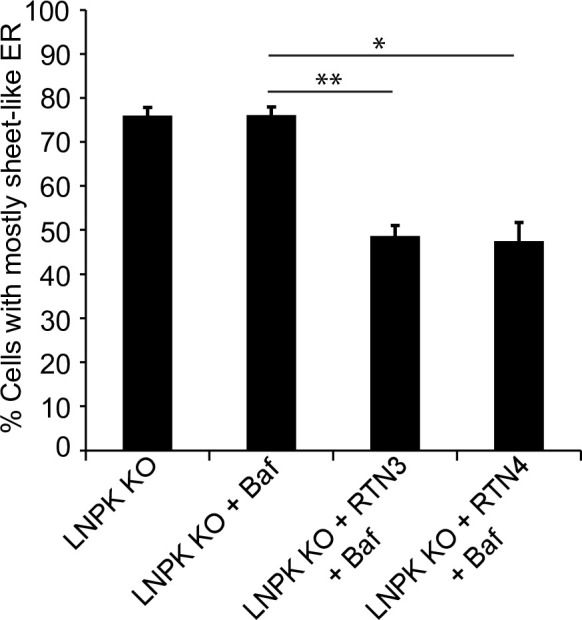
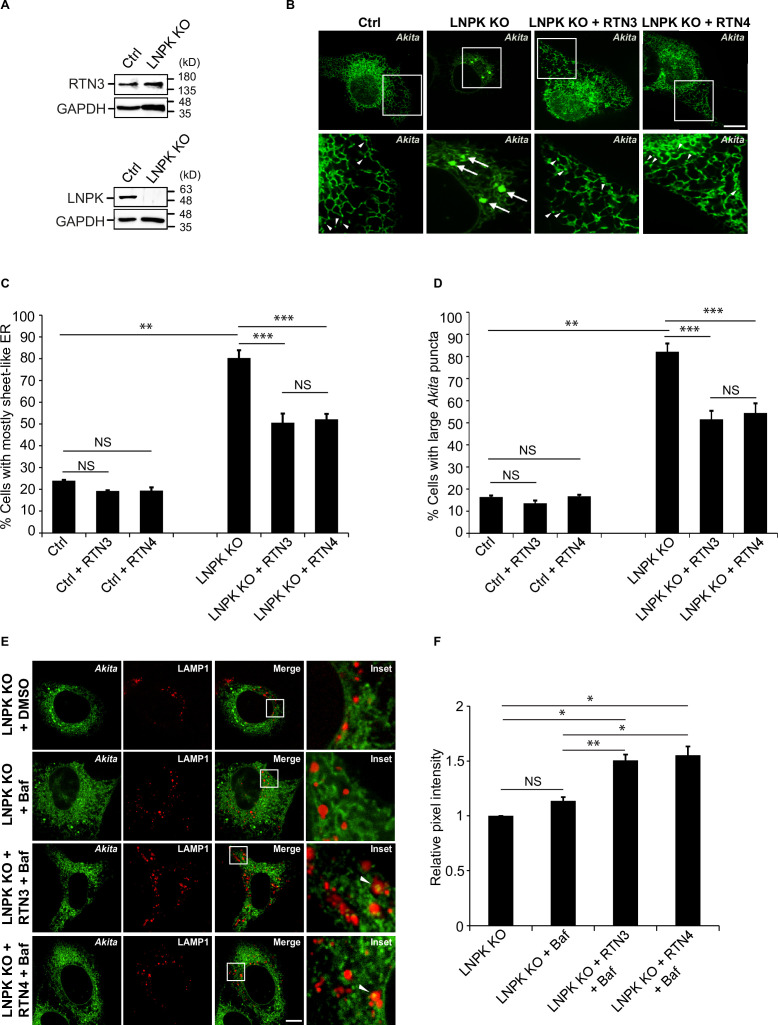
Figure 6. Restoration of the tubular endoplasmic reticulum (ER) network in LNPK KO cells reduces the accumulation of large Akita puncta.
(A) Ctrl and LNPK KO cells were analyzed for the expression of endogenous RTN3 (top) or LNPK (bottom) by immunoblotting. Glyceraldehyde 3-phosphate dehydrogenase (GAPDH) was used as a loading control. (B) mCherry-RTN3 or mCherry-RTN4 was transfected in control and LNPK KO cells expressing Akita-sfGFP and analyzed by confocal microscopy. Arrowheads mark representative small Akita puncta present in the ER tubules. Arrows mark large Akita puncta (≥0.5 µm2). (C) Bar graph showing the % of cells with mostly sheet-like ER for the data shown in (B). (D) Bar graph showing the % of cells with large Akita-sfGFP puncta for the data shown in (B). (E) mTurquoise2-RTN3 or mTurquoise2-RTN4 was transfected in control and LNPK KO cells expressing Akita-sfGFP and LAMP1-mCherry, and treated with Baf. (F) Quantitation of Akita-sfGFP in LAMP1-mCherry structures for the data shown in (E). The DMSO control for each condition was set to 1.0. Scale bar in (B) and (E), 10 µm. Error bars in (C), (D), and (F) represent SEM; n = 3 independent experiments. Approximately 30–40 cells were quantified in each experiment. NS: not significant (p≥0.05); *p<0.05, **p<0.01, ***p<0.001, Student’s unpaired t-test.
Figure 6—figure supplement 1. The reticulons partially restored the tubular network in LNPK KO cells.


