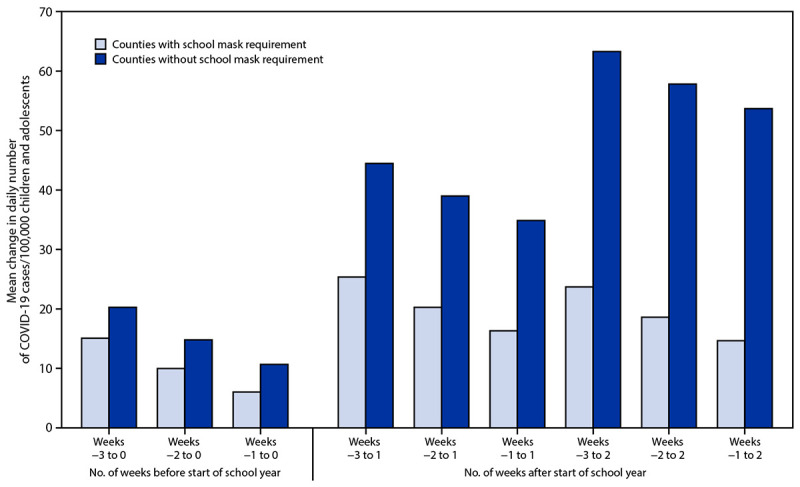
FIGURE.

Mean county-level change in daily number of COVID-19 cases per 100,000 children and adolescents aged <18 years in counties (N = 520) with and without school mask requirements* before and after the start of the 2021–22 school year — United States, July 1–September 4, 2021
* Among 520 counties, 198 (38%) had a school mask requirement and 322 (62%) did not have a school mask requirement.
